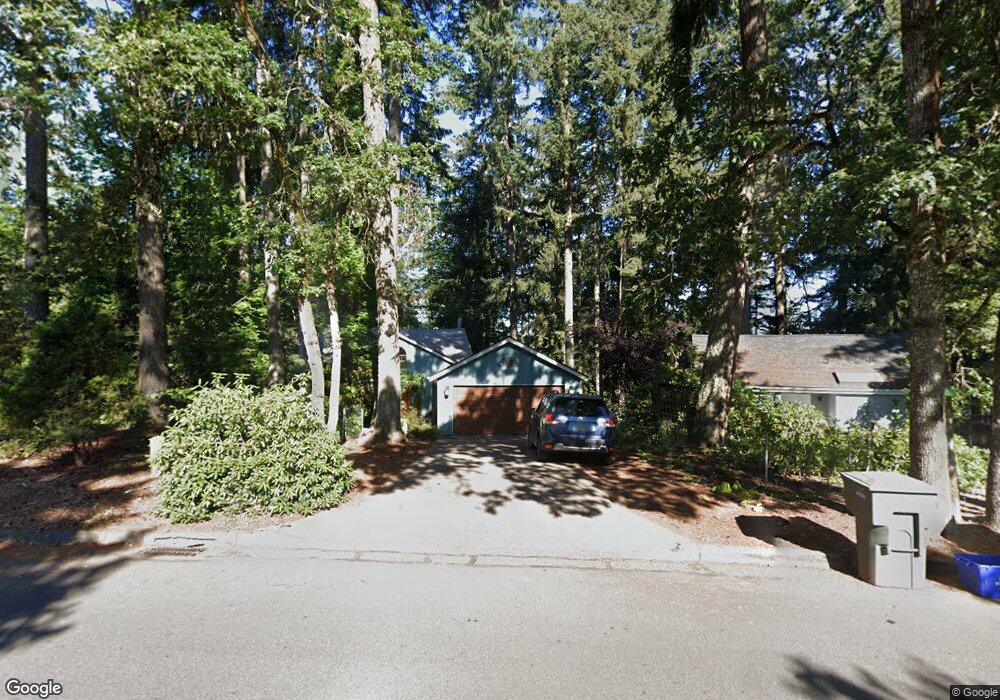
4270 N Shasta Loop Eugene, OR 97405
Southeast Eugene NeighborhoodEstimated Value: $798,000 - $957,000
4
Beds
3
Baths
2,700
Sq Ft
$320/Sq Ft
Est. Value
About This Home
This home is located at 4270 N Shasta Loop, Eugene, OR 97405 and is currently estimated at $864,248, approximately $320 per square foot. 4270 N Shasta Loop is a home located in Lane County with nearby schools including Edgewood Community Elementary School, Spencer Butte Middle School, and South Eugene High School.
Ownership History
Date
Name
Owned For
Owner Type
Purchase Details
Closed on
Mar 13, 2025
Sold by
Monroe Scott M and Simons Anne D
Bought by
Monroe Simons Living Trust and Monroe
Current Estimated Value
Purchase Details
Closed on
May 17, 2004
Sold by
Rear Charles D and Macbeth Rear Layne B
Bought by
Monroe Scott M and Simons Anne D
Home Financials for this Owner
Home Financials are based on the most recent Mortgage that was taken out on this home.
Original Mortgage
$284,000
Interest Rate
5.77%
Mortgage Type
Purchase Money Mortgage
Purchase Details
Closed on
Jun 11, 2003
Sold by
Giustina E Danell
Bought by
Rear Charles D and Macbeth Rear Layne B
Home Financials for this Owner
Home Financials are based on the most recent Mortgage that was taken out on this home.
Original Mortgage
$279,000
Interest Rate
5.61%
Mortgage Type
Purchase Money Mortgage
Purchase Details
Closed on
Jun 13, 2001
Sold by
Kempner Kenneth M
Bought by
Giustina E Danell
Home Financials for this Owner
Home Financials are based on the most recent Mortgage that was taken out on this home.
Original Mortgage
$178,000
Interest Rate
7.14%
Create a Home Valuation Report for This Property
The Home Valuation Report is an in-depth analysis detailing your home's value as well as a comparison with similar homes in the area
Home Values in the Area
Average Home Value in this Area
Purchase History
| Date | Buyer | Sale Price | Title Company |
|---|---|---|---|
| Monroe Simons Living Trust | -- | None Listed On Document | |
| Monroe Scott M | $355,000 | Western Title & Escrow Co | |
| Rear Charles D | $310,000 | Fidelity Natl Title Ins Co O | |
| Giustina E Danell | $278,000 | Cascade Title Co |
Source: Public Records
Mortgage History
| Date | Status | Borrower | Loan Amount |
|---|---|---|---|
| Previous Owner | Monroe Scott M | $284,000 | |
| Previous Owner | Rear Charles D | $279,000 | |
| Previous Owner | Giustina E Danell | $178,000 |
Source: Public Records
Tax History
| Year | Tax Paid | Tax Assessment Tax Assessment Total Assessment is a certain percentage of the fair market value that is determined by local assessors to be the total taxable value of land and additions on the property. | Land | Improvement |
|---|---|---|---|---|
| 2025 | $9,830 | $504,541 | -- | -- |
| 2024 | $9,708 | $489,846 | -- | -- |
| 2023 | $9,708 | $466,620 | $0 | $0 |
| 2022 | $8,923 | $453,030 | $0 | $0 |
| 2021 | $8,381 | $439,835 | $0 | $0 |
| 2020 | $8,182 | $427,025 | $0 | $0 |
| 2019 | $7,774 | $414,588 | $0 | $0 |
| 2018 | $7,307 | $390,789 | $0 | $0 |
| 2017 | $6,867 | $390,789 | $0 | $0 |
| 2016 | $6,651 | $379,407 | $0 | $0 |
| 2015 | $6,549 | $368,356 | $0 | $0 |
| 2014 | $6,549 | $357,627 | $0 | $0 |
Source: Public Records
Map
Nearby Homes
- 4835 Elva Ln
- 0 N Shasta Loop Unit 384285834
- 1755 E 43rd Ave
- 0 Wendell Ln Unit 200453475
- 0 Wendell Ln Unit 279865930
- 0 Wendell Ln Unit 1
- 1210 E 38th Ave
- 3790 Onyx St
- 1865 E 43rd Ave
- 910 E 43rd Ave
- 1862 E 43rd Ave
- 4320 Fox Hollow Rd
- 4364 Fox Hollow Rd
- 4429 Fox Hollow Rd Unit 3
- 3817 E Amazon Dr
- 1180 E 37th Ave
- 4015 Spring Knoll Dr
- 2015 E 43rd Ave
- 3945 Spring Blvd
- 4733 E Amazon Dr
- 4240 N Shasta Loop
- 4310 N Shasta Loop
- 4277 N Shasta Loop
- 4255 N Shasta Loop
- 4315 N Shasta Loop
- 4233 N Shasta Loop
- 4330 N Shasta Loop
- 4345 N Shasta Loop
- 4040 N Shasta Loop
- 4211 N Shasta Loop
- 4333 N Shasta Loop
- 4347 N Shasta Loop
- 4336 N Shasta Loop
- 4349 N Shasta Loop
- 4340 N Shasta Loop
- 4350 N Shasta Loop
- 4358 N Shasta Loop
- 4370 N Shasta Loop
- 1194 E 41st Ave
- 4360 N Shasta Loop
Your Personal Tour Guide
Ask me questions while you tour the home.