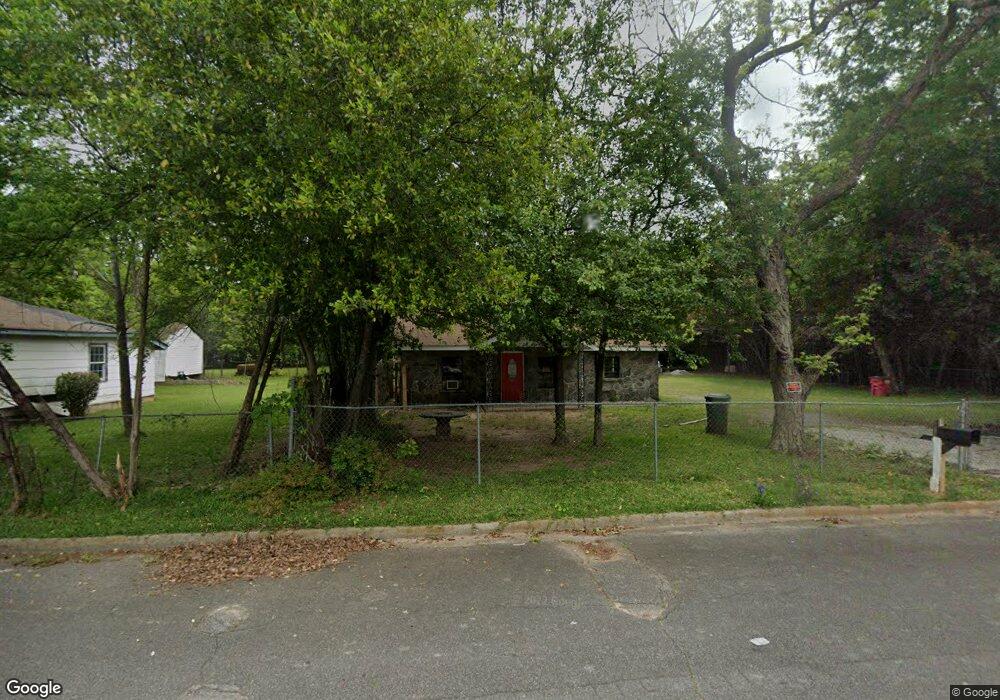
4274 Trammel Ave Macon, GA 31206
Estimated Value: $80,000 - $116,000
3
Beds
2
Baths
1,610
Sq Ft
$63/Sq Ft
Est. Value
About This Home
This home is located at 4274 Trammel Ave, Macon, GA 31206 and is currently estimated at $101,293, approximately $62 per square foot. 4274 Trammel Ave is a home located in Bibb County with nearby schools including Bruce Elementary School, Rutland Middle School, and Rutland High School.
Ownership History
Date
Name
Owned For
Owner Type
Purchase Details
Closed on
Mar 13, 2014
Sold by
Wells Fargo Bank Na
Bought by
Velasquez Guillermo D
Current Estimated Value
Purchase Details
Closed on
Jun 28, 2013
Sold by
County Of Bibb
Bought by
Wells Fargo Bank Na
Purchase Details
Closed on
Mar 4, 2005
Sold by
Thomas John
Bought by
Seay Toya
Home Financials for this Owner
Home Financials are based on the most recent Mortgage that was taken out on this home.
Original Mortgage
$38,400
Interest Rate
5.61%
Mortgage Type
New Conventional
Purchase Details
Closed on
Jan 28, 2005
Sold by
Lasalle Bank National Assn
Bought by
Thomas John
Home Financials for this Owner
Home Financials are based on the most recent Mortgage that was taken out on this home.
Original Mortgage
$38,400
Interest Rate
5.61%
Mortgage Type
New Conventional
Purchase Details
Closed on
Dec 7, 2004
Purchase Details
Closed on
Oct 16, 2001
Create a Home Valuation Report for This Property
The Home Valuation Report is an in-depth analysis detailing your home's value as well as a comparison with similar homes in the area
Home Values in the Area
Average Home Value in this Area
Purchase History
| Date | Buyer | Sale Price | Title Company |
|---|---|---|---|
| Velasquez Guillermo D | $12,000 | None Available | |
| Wells Fargo Bank Na | $2,400 | None Available | |
| Seay Toya | $51,000 | None Available | |
| Thomas John | $18,000 | None Avilebel | |
| -- | $32,500 | -- | |
| -- | $53,000 | -- |
Source: Public Records
Mortgage History
| Date | Status | Borrower | Loan Amount |
|---|---|---|---|
| Previous Owner | Seay Toya | $38,400 |
Source: Public Records
Tax History Compared to Growth
Tax History
| Year | Tax Paid | Tax Assessment Tax Assessment Total Assessment is a certain percentage of the fair market value that is determined by local assessors to be the total taxable value of land and additions on the property. | Land | Improvement |
|---|---|---|---|---|
| 2025 | $830 | $33,778 | $2,300 | $31,478 |
| 2024 | $858 | $33,778 | $2,300 | $31,478 |
| 2023 | $658 | $25,909 | $2,300 | $23,609 |
| 2022 | $689 | $19,894 | $1,474 | $18,420 |
| 2021 | $526 | $13,832 | $938 | $12,894 |
| 2020 | $468 | $12,057 | $1,005 | $11,052 |
| 2019 | $428 | $10,935 | $804 | $10,131 |
| 2018 | $836 | $10,935 | $804 | $10,131 |
| 2017 | $410 | $10,935 | $804 | $10,131 |
| 2016 | $378 | $10,935 | $804 | $10,131 |
| 2015 | $235 | $10,935 | $804 | $10,131 |
| 2014 | $673 | $11,946 | $804 | $11,142 |
Source: Public Records
Map
Nearby Homes
- 4249 Trammel Ave
- 4283 Irving Ave
- 4268 Marion Ave
- 4054 Marion Ave
- 4305 Marion Ave
- 4189 Marion Ave
- 4255 Worsham Ave
- 4319 Worsham Ave
- 4298 Worsham Ave
- 4030 Marion Ave
- 4378 Mikado Ave
- 4386 Mikado Ave
- 912 Thomas St
- 4409 Mikado Ave
- 4235 Mikado Ave
- 4062 Broadway
- 110 Debbie Ct
- 562 Richmond St
- 935 Troupe St
- 567 Richmond St
- 4274 Trammel Ave Unit 203
- 4274 Trammell Ave Unit 203
- 4274 Trammell Ave
- 4266 Trammel Ave
- 4270 Trammel Ave
- 4273 Roy Ave
- 4323 Roy Ave
- 4265 Roy Ave
- 4253 Trammell Ave
- 4275 Trammel Ave
- 4271 Trammel Ave
- 4261 Roy Ave
- 4271 Trammel Ave
- 4259 Trammell Ave
- 621 Carmen Place
- 629 Carmen Place
- 4291 Trammel Ave
- 4259 Trammel Ave
- 643 Carmen Place
- 4255 Roy Ave