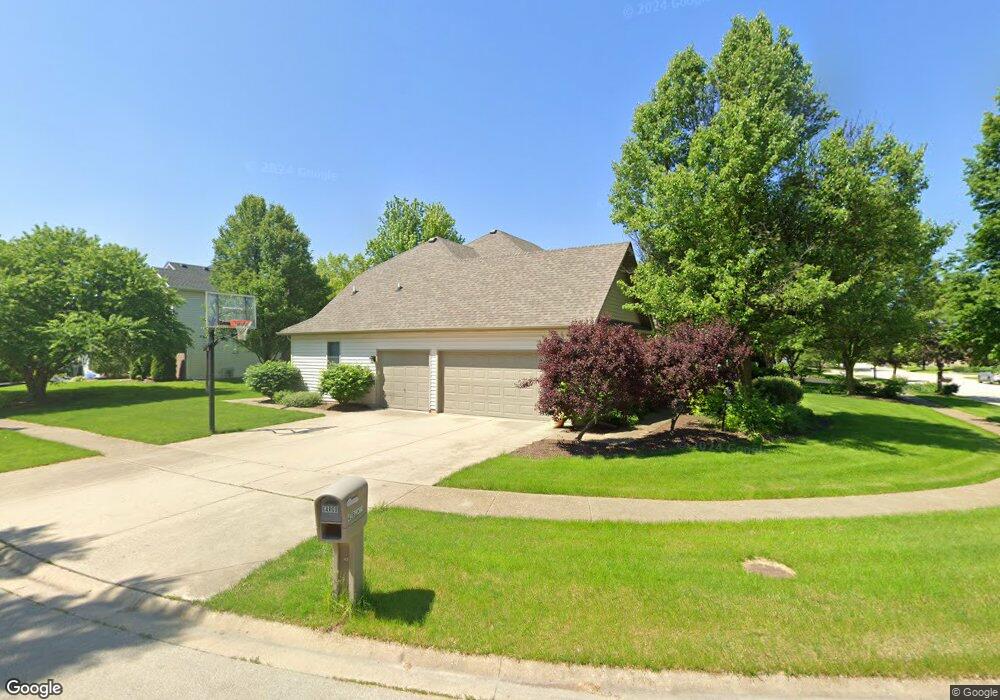
428 Camden Cir Oswego, IL 60543
South Oswego NeighborhoodEstimated Value: $466,000 - $502,000
4
Beds
3
Baths
2,558
Sq Ft
$187/Sq Ft
Est. Value
About This Home
This home is located at 428 Camden Cir, Oswego, IL 60543 and is currently estimated at $479,372, approximately $187 per square foot. 428 Camden Cir is a home located in Kendall County with nearby schools including Prairie Point Elementary School, Traughber Junior High School, and Oswego High School.
Ownership History
Date
Name
Owned For
Owner Type
Purchase Details
Closed on
Mar 18, 2010
Sold by
Federal National Mortgage Association
Bought by
Gargo Hilary and Gargo Daniel J
Current Estimated Value
Home Financials for this Owner
Home Financials are based on the most recent Mortgage that was taken out on this home.
Original Mortgage
$225,834
Outstanding Balance
$150,573
Interest Rate
5.1%
Mortgage Type
FHA
Estimated Equity
$328,799
Purchase Details
Closed on
Jul 15, 2009
Sold by
Graziano John
Bought by
Federal National Mortgage Association
Purchase Details
Closed on
Jul 31, 2000
Sold by
T J Baumgartner Custom Homes Inc
Bought by
Graziano John and Graziano Angela
Home Financials for this Owner
Home Financials are based on the most recent Mortgage that was taken out on this home.
Original Mortgage
$239,900
Interest Rate
8.12%
Mortgage Type
Stand Alone First
Create a Home Valuation Report for This Property
The Home Valuation Report is an in-depth analysis detailing your home's value as well as a comparison with similar homes in the area
Home Values in the Area
Average Home Value in this Area
Purchase History
| Date | Buyer | Sale Price | Title Company |
|---|---|---|---|
| Gargo Hilary | $230,000 | Attorneys Title Guaranty Fun | |
| Federal National Mortgage Association | -- | None Available | |
| Graziano John | $249,000 | Chicago Title Insurance Co |
Source: Public Records
Mortgage History
| Date | Status | Borrower | Loan Amount |
|---|---|---|---|
| Open | Gargo Hilary | $225,834 | |
| Previous Owner | Graziano John | $239,900 |
Source: Public Records
Tax History Compared to Growth
Tax History
| Year | Tax Paid | Tax Assessment Tax Assessment Total Assessment is a certain percentage of the fair market value that is determined by local assessors to be the total taxable value of land and additions on the property. | Land | Improvement |
|---|---|---|---|---|
| 2024 | $10,332 | $134,396 | $28,486 | $105,910 |
| 2023 | $9,223 | $118,935 | $25,209 | $93,726 |
| 2022 | $9,223 | $108,122 | $22,917 | $85,205 |
| 2021 | $8,895 | $101,049 | $21,418 | $79,631 |
| 2020 | $8,795 | $99,068 | $20,998 | $78,070 |
| 2019 | $8,717 | $96,794 | $20,998 | $75,796 |
| 2018 | $9,365 | $101,868 | $18,948 | $82,920 |
| 2017 | $9,146 | $95,203 | $17,708 | $77,495 |
| 2016 | $8,990 | $92,430 | $17,192 | $75,238 |
| 2015 | $9,231 | $90,618 | $16,855 | $73,763 |
| 2014 | -- | $87,979 | $16,364 | $71,615 |
| 2013 | -- | $87,979 | $16,364 | $71,615 |
Source: Public Records
Map
Nearby Homes
- 315 White Pines Ln
- 406 Windsor Dr
- 483 Deerfield Dr
- 482 Deerfield Dr
- 538 Sudbury Cir
- 676 Cumberland Ln
- 668 Cumberland Ln
- 673 Cumberland Ln
- 716 Pinehurst Ln
- 609 Chestnut Dr
- 851 Claridge Dr
- 714 Pinehurst Ln
- 770 Dartmouth Ln
- 777 Dartmouth Ln
- 639 Vista Dr
- 395 Danforth Dr
- 616 Briarwood Ln
- 210 Dorset Ave
- 318 Monica Ln
- 2489 Semillon St
- 426 Camden Cir
- 436 Camden Cir
- 454 Camden Cir
- 438 Camden Cir
- 435 Camden Cir
- 435 Camden Cir Unit BASEMENT
- 550 Danbury Dr
- 424 Camden Cir
- 427 Camden Cir Unit 2
- 425 Camden Cir
- 437 Camden Cir
- 429 Camden Cir
- 546 Danbury Dr
- 552 Danbury Dr
- 431 Camden Cir
- 440 Camden Cir
- 554 Danbury Dr
- 544 Danbury Dr
- 255 Isleview Dr
- 257 Isleview Dr Unit 1