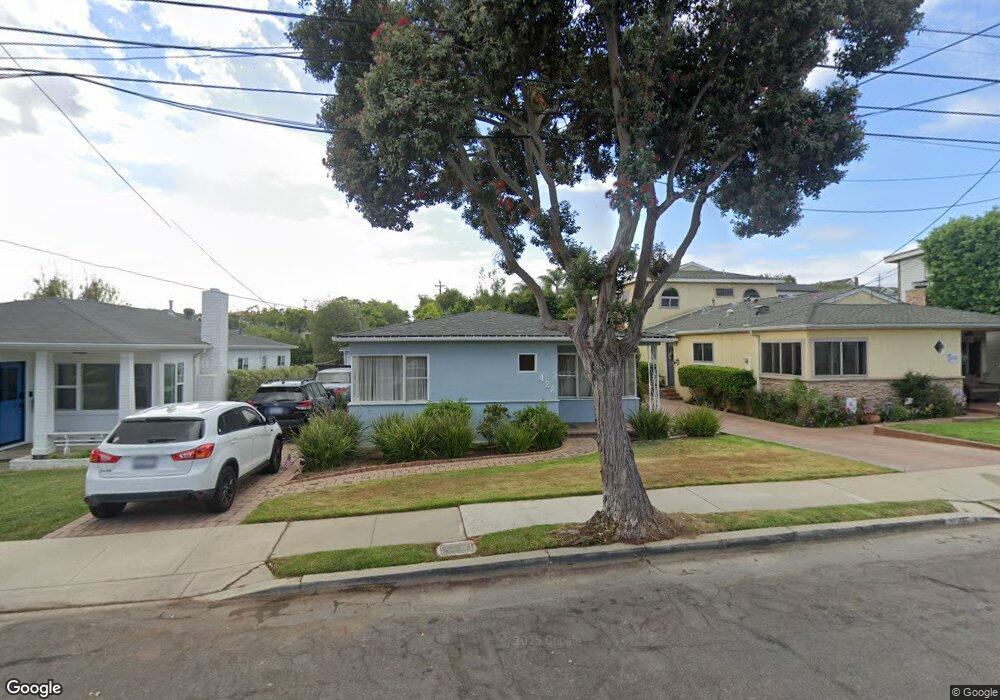
428 W Oak Ave El Segundo, CA 90245
Estimated Value: $1,606,000 - $1,838,000
3
Beds
2
Baths
1,406
Sq Ft
$1,231/Sq Ft
Est. Value
About This Home
This home is located at 428 W Oak Ave, El Segundo, CA 90245 and is currently estimated at $1,730,979, approximately $1,231 per square foot. 428 W Oak Ave is a home located in Los Angeles County with nearby schools including Richmond Street Elementary School, El Segundo Middle School, and El Segundo High School.
Ownership History
Date
Name
Owned For
Owner Type
Purchase Details
Closed on
May 29, 2019
Sold by
Barsky Claudia D
Bought by
Barsky Claudia D and Claudia D Barsky Living Trust
Current Estimated Value
Purchase Details
Closed on
Oct 22, 2009
Sold by
Barsky Claudia D
Bought by
Barsky Mel S
Home Financials for this Owner
Home Financials are based on the most recent Mortgage that was taken out on this home.
Original Mortgage
$322,000
Outstanding Balance
$209,401
Interest Rate
5%
Mortgage Type
New Conventional
Estimated Equity
$1,521,578
Purchase Details
Closed on
Dec 10, 1993
Sold by
Dunkel Thomas Richard and Dunkel Patricia Jeanne
Bought by
Barsky Mel S
Home Financials for this Owner
Home Financials are based on the most recent Mortgage that was taken out on this home.
Original Mortgage
$224,000
Interest Rate
3.62%
Create a Home Valuation Report for This Property
The Home Valuation Report is an in-depth analysis detailing your home's value as well as a comparison with similar homes in the area
Home Values in the Area
Average Home Value in this Area
Purchase History
| Date | Buyer | Sale Price | Title Company |
|---|---|---|---|
| Barsky Claudia D | -- | None Available | |
| Barsky Mel S | -- | Investors Title Company | |
| Barsky Claudia D | -- | Investors Title Company | |
| Barsky Mel S | $280,000 | Investors Title Company |
Source: Public Records
Mortgage History
| Date | Status | Borrower | Loan Amount |
|---|---|---|---|
| Open | Barsky Claudia D | $322,000 | |
| Closed | Barsky Mel S | $224,000 | |
| Closed | Barsky Mel S | $30,000 |
Source: Public Records
Tax History Compared to Growth
Tax History
| Year | Tax Paid | Tax Assessment Tax Assessment Total Assessment is a certain percentage of the fair market value that is determined by local assessors to be the total taxable value of land and additions on the property. | Land | Improvement |
|---|---|---|---|---|
| 2025 | $5,418 | $475,886 | $380,210 | $95,676 |
| 2024 | $5,418 | $466,555 | $372,755 | $93,800 |
| 2023 | $5,281 | $457,408 | $365,447 | $91,961 |
| 2022 | $5,338 | $448,440 | $358,282 | $90,158 |
| 2021 | $5,263 | $439,648 | $351,257 | $88,391 |
| 2019 | $5,087 | $426,610 | $340,840 | $85,770 |
| 2018 | $4,720 | $418,246 | $334,157 | $84,089 |
| 2016 | $4,578 | $402,007 | $321,182 | $80,825 |
| 2015 | $4,521 | $395,969 | $316,358 | $79,611 |
| 2014 | $4,433 | $388,213 | $310,161 | $78,052 |
Source: Public Records
Map
Nearby Homes
- 724 Loma Vista St
- 505 W Maple Ave
- 836 Loma Vista St
- 125 W Sycamore Ave
- 955 Virginia St
- 900 Cedar St Unit 308
- 935 Main St Unit 303
- 360 Hillcrest St
- 931 Hillcrest St
- 950 Main St Unit 205
- 329 E Maple Ave
- 212 E Imperial Ave Unit A
- 212 E Imperial Ave Unit E
- 426 E Imperial Ave
- 516 Penn St
- 848 Penn St
- 926 Fairing Place
- 226 Arena St Unit A
- 574 E Imperial Ave
- 608 Lomita St