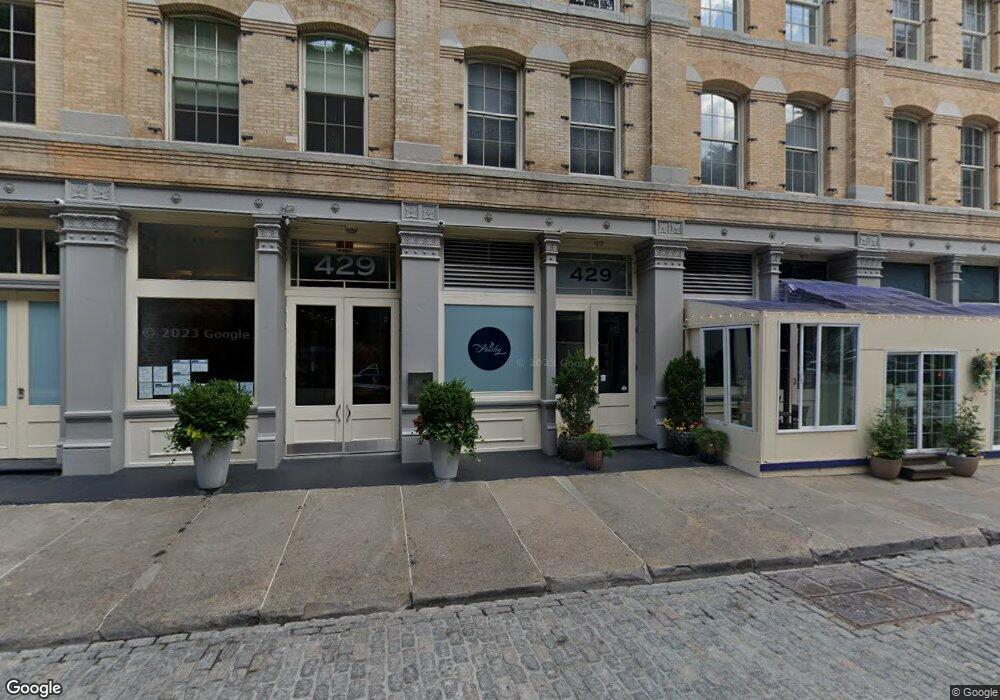
429-435 Greenwich St Unit 6B New York, NY 10013
Tribeca NeighborhoodEstimated Value: $3,452,135 - $5,351,000
--
Bed
--
Bath
2,118
Sq Ft
$2,176/Sq Ft
Est. Value
About This Home
This home is located at 429-435 Greenwich St Unit 6B, New York, NY 10013 and is currently estimated at $4,609,034, approximately $2,176 per square foot. 429-435 Greenwich St Unit 6B is a home located in New York County with nearby schools including P.S. 234 Independence School, Middle School 297, and Lower Manhattan Community Middle School.
Ownership History
Date
Name
Owned For
Owner Type
Purchase Details
Closed on
Aug 30, 2023
Sold by
Selcuk Sinan
Bought by
Selcuk Sinan
Current Estimated Value
Purchase Details
Closed on
Dec 22, 2009
Sold by
Campbell Diane A and Campbell Kenneth L
Bought by
Selcuk Sinan
Home Financials for this Owner
Home Financials are based on the most recent Mortgage that was taken out on this home.
Original Mortgage
$1,225,000
Outstanding Balance
$794,080
Interest Rate
4.78%
Mortgage Type
Purchase Money Mortgage
Estimated Equity
$3,814,954
Purchase Details
Closed on
Mar 30, 2000
Sold by
Joffe Martin L and Joffe Zerline C
Bought by
Campbell Kenneth L and Campbell Diane A
Home Financials for this Owner
Home Financials are based on the most recent Mortgage that was taken out on this home.
Original Mortgage
$1,280,000
Interest Rate
6.87%
Mortgage Type
Purchase Money Mortgage
Purchase Details
Closed on
Mar 10, 1998
Sold by
Joffe Martin L
Bought by
Joffe Martin L and Joffe Zerline C
Create a Home Valuation Report for This Property
The Home Valuation Report is an in-depth analysis detailing your home's value as well as a comparison with similar homes in the area
Home Values in the Area
Average Home Value in this Area
Purchase History
| Date | Buyer | Sale Price | Title Company |
|---|---|---|---|
| Selcuk Sinan | -- | -- | |
| Selcuk Sinan | -- | -- | |
| Selcuk Sinan | $2,450,000 | -- | |
| Selcuk Sinan | $2,450,000 | -- | |
| Campbell Kenneth L | $1,600,000 | All New York Title Agency In | |
| Campbell Kenneth L | $1,600,000 | All New York Title Agency In | |
| Joffe Martin L | -- | -- | |
| Joffe Martin L | -- | -- |
Source: Public Records
Mortgage History
| Date | Status | Borrower | Loan Amount |
|---|---|---|---|
| Open | Selcuk Sinan | $1,225,000 | |
| Closed | Selcuk Sinan | $1,225,000 | |
| Previous Owner | Campbell Kenneth L | $1,280,000 |
Source: Public Records
Tax History Compared to Growth
Tax History
| Year | Tax Paid | Tax Assessment Tax Assessment Total Assessment is a certain percentage of the fair market value that is determined by local assessors to be the total taxable value of land and additions on the property. | Land | Improvement |
|---|---|---|---|---|
| 2025 | $34,381 | $278,588 | $26,921 | $251,667 |
| 2024 | $34,381 | $275,001 | $26,921 | $248,080 |
| 2023 | $33,432 | $272,540 | $26,921 | $245,619 |
| 2022 | $31,999 | $261,534 | $26,921 | $234,613 |
| 2021 | $32,082 | $261,534 | $26,921 | $234,613 |
| 2020 | $26,465 | $289,689 | $26,921 | $262,768 |
| 2019 | $25,067 | $283,180 | $26,921 | $256,259 |
| 2018 | $28,726 | $273,280 | $26,921 | $246,359 |
| 2017 | $26,268 | $209,682 | $26,921 | $182,761 |
| 2016 | $25,651 | $243,566 | $26,921 | $216,645 |
| 2015 | $13,504 | $204,473 | $26,921 | $177,552 |
| 2014 | $13,504 | $198,282 | $26,921 | $171,361 |
Source: Public Records
Map
Nearby Homes
- 60 Collister St Unit PH4A
- 415 Greenwich St Unit PH-A
- 52 Laight St Unit 2
- 165 Hudson St Unit 3B
- 165 Hudson St Unit PHA
- 169 Hudson St Unit 1-D
- 33 Vestry St Unit 6
- 39 Vestry St Unit PHA
- 46 Laight St Unit 4
- 135 Hudson St Unit 6F
- 44 Laight St Unit 6C
- 71 Laight St Unit 3B
- 181 Hudson St Unit 2B
- 60 Beach St Unit 3C
- 76 Laight St Unit 3
- 443 Greenwich St Unit PH-D
- 53 N Moore St Unit 3A
- 53 N Moore St Unit 2F East
- 53 N Moore St Unit 2F
- 55 Vestry St Unit THA
- 429-435 Greenwich St Unit 8A
- 429-435 Greenwich St Unit 4C
- 429-435 Greenwich St Unit P15
- 429-435 Greenwich St Unit 5B
- 429-435 Greenwich St Unit 2A
- 429-435 Greenwich St Unit E
- 429-435 Greenwich St Unit 9B
- 429-435 Greenwich St Unit 6A
- 429-435 Greenwich St Unit 4B
- 429-435 Greenwich St Unit 2B
- 429-435 Greenwich St Unit 3A
- 429-435 Greenwich St Unit W
- 429-435 Greenwich St Unit 3B
- 429-435 Greenwich St Unit 5A
- 429-435 Greenwich St Unit 7A
- 429-435 Greenwich St Unit 4A
- 429-435 Greenwich St Unit 2D
- 429-435 Greenwich St Unit 9A
- 429-435 Greenwich St Unit P18
- 429-435 Greenwich St Unit 7B