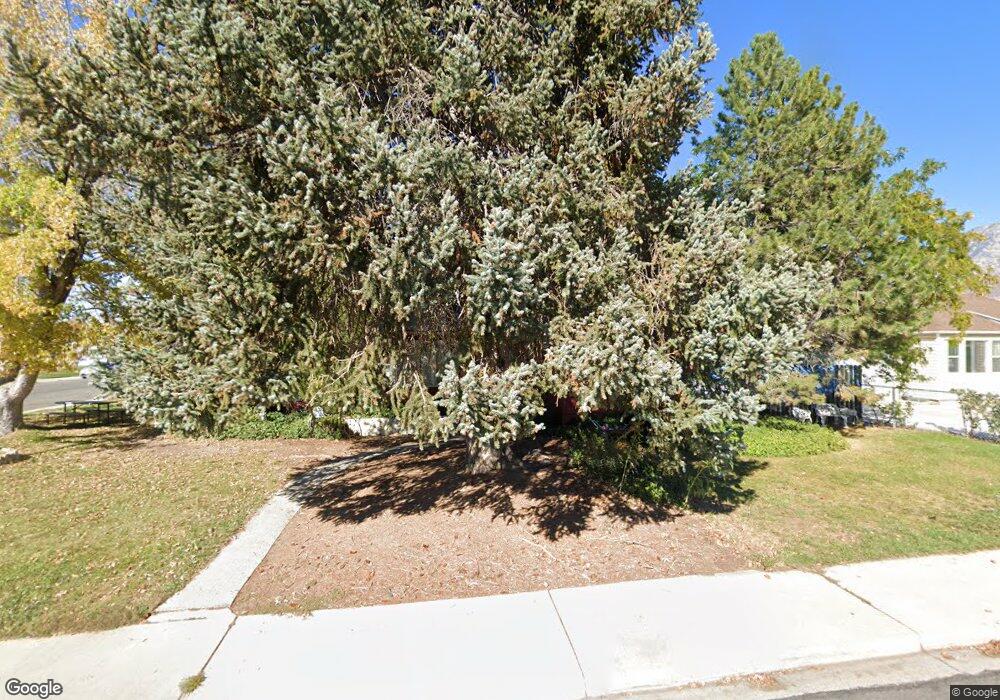
429 E 1910 S Orem, UT 84058
Cherry Hill NeighborhoodEstimated Value: $408,000 - $422,000
3
Beds
1
Bath
1,115
Sq Ft
$372/Sq Ft
Est. Value
About This Home
This home is located at 429 E 1910 S, Orem, UT 84058 and is currently estimated at $414,600, approximately $371 per square foot. 429 E 1910 S is a home located in Utah County with nearby schools including Cherry Hill Elementary School, Lakeridge Jr High School, and Mountain View High School.
Ownership History
Date
Name
Owned For
Owner Type
Purchase Details
Closed on
Nov 18, 2019
Sold by
Gallagher Diane C
Bought by
Thomas Kara
Current Estimated Value
Home Financials for this Owner
Home Financials are based on the most recent Mortgage that was taken out on this home.
Original Mortgage
$220,000
Outstanding Balance
$193,156
Interest Rate
3.5%
Mortgage Type
New Conventional
Estimated Equity
$221,444
Purchase Details
Closed on
Dec 31, 2012
Sold by
Rideout Simon
Bought by
Bersie Michael
Purchase Details
Closed on
Aug 22, 1997
Sold by
Hoskins Dorothy E
Bought by
Bersie Michael
Home Financials for this Owner
Home Financials are based on the most recent Mortgage that was taken out on this home.
Original Mortgage
$104,397
Interest Rate
7.43%
Mortgage Type
FHA
Purchase Details
Closed on
Jun 18, 1997
Sold by
Hoskins Philip C
Bought by
Hoskins Dorothy E
Purchase Details
Closed on
Jun 13, 1997
Sold by
Edwards Sally J
Bought by
Hoskins Dorothy E
Create a Home Valuation Report for This Property
The Home Valuation Report is an in-depth analysis detailing your home's value as well as a comparison with similar homes in the area
Home Values in the Area
Average Home Value in this Area
Purchase History
| Date | Buyer | Sale Price | Title Company |
|---|---|---|---|
| Thomas Kara | -- | Backman Orem | |
| Bersie Michael | -- | Access Title Co | |
| Bersie Michael | -- | First American Title | |
| Hoskins Dorothy E | -- | First American Title | |
| Hoskins Dorothy E | -- | First American Title |
Source: Public Records
Mortgage History
| Date | Status | Borrower | Loan Amount |
|---|---|---|---|
| Open | Thomas Kara | $220,000 | |
| Previous Owner | Bersie Michael | $104,397 |
Source: Public Records
Tax History
| Year | Tax Paid | Tax Assessment Tax Assessment Total Assessment is a certain percentage of the fair market value that is determined by local assessors to be the total taxable value of land and additions on the property. | Land | Improvement |
|---|---|---|---|---|
| 2025 | $1,617 | $209,110 | -- | -- |
| 2024 | $1,617 | $197,670 | $0 | $0 |
| 2023 | $1,494 | $196,405 | $0 | $0 |
| 2022 | $1,540 | $196,020 | $0 | $0 |
| 2021 | $1,315 | $253,600 | $133,100 | $120,500 |
| 2020 | $1,179 | $223,500 | $106,500 | $117,000 |
| 2019 | $1,014 | $199,900 | $92,300 | $107,600 |
| 2018 | $969 | $182,400 | $88,800 | $93,600 |
| 2017 | $889 | $89,705 | $0 | $0 |
| 2016 | $887 | $82,500 | $0 | $0 |
| 2015 | $880 | $77,385 | $0 | $0 |
| 2014 | $824 | $72,160 | $0 | $0 |
Source: Public Records
Map
Nearby Homes
Your Personal Tour Guide
Ask me questions while you tour the home.