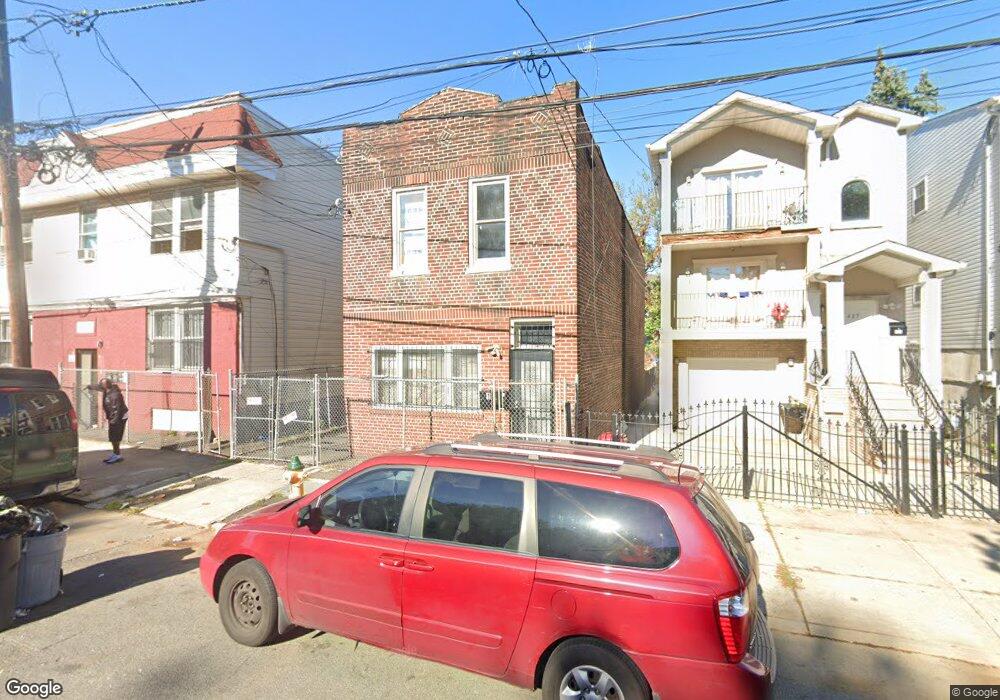
429 S 18th St Unit 1 Newark, NJ 07103
West Side NeighborhoodEstimated Value: $461,000 - $620,000
3
Beds
1
Bath
1,872
Sq Ft
$276/Sq Ft
Est. Value
About This Home
This home is located at 429 S 18th St Unit 1, Newark, NJ 07103 and is currently estimated at $517,256, approximately $276 per square foot. 429 S 18th St Unit 1 is a home located in Essex County with nearby schools including Hawthorne Avenue Elementary School, Lincoln Elementary School, and Louise A. Spencer School.
Ownership History
Date
Name
Owned For
Owner Type
Purchase Details
Closed on
Apr 21, 2021
Sold by
Santiago Victor
Bought by
Jones Kazim
Current Estimated Value
Home Financials for this Owner
Home Financials are based on the most recent Mortgage that was taken out on this home.
Original Mortgage
$294,566
Outstanding Balance
$266,382
Interest Rate
3.1%
Mortgage Type
FHA
Estimated Equity
$250,874
Purchase Details
Closed on
Apr 9, 2019
Sold by
429 S 18 Ventures Llc
Bought by
Santiago Victor
Purchase Details
Closed on
Oct 21, 1997
Sold by
Spruell Quincy
Bought by
Powell Lennon
Purchase Details
Closed on
Oct 14, 1997
Sold by
Spruell Ramond
Bought by
Powell Lennon
Purchase Details
Closed on
Mar 29, 1990
Sold by
Spruell Jr Chancy L and Spruell Ramon F
Bought by
Spruell Chancy Lee
Create a Home Valuation Report for This Property
The Home Valuation Report is an in-depth analysis detailing your home's value as well as a comparison with similar homes in the area
Home Values in the Area
Average Home Value in this Area
Purchase History
| Date | Buyer | Sale Price | Title Company |
|---|---|---|---|
| Jones Kazim | $300,000 | Prestige Title Agency Inc | |
| Santiago Victor | $235,000 | -- | |
| Powell Lennon | $6,500 | -- | |
| Powell Lennon | $6,500 | -- | |
| Spruell Chancy Lee | -- | -- |
Source: Public Records
Mortgage History
| Date | Status | Borrower | Loan Amount |
|---|---|---|---|
| Open | Jones Kazim | $294,566 |
Source: Public Records
Tax History Compared to Growth
Tax History
| Year | Tax Paid | Tax Assessment Tax Assessment Total Assessment is a certain percentage of the fair market value that is determined by local assessors to be the total taxable value of land and additions on the property. | Land | Improvement |
|---|---|---|---|---|
| 2025 | $8,343 | $223,800 | $31,300 | $192,500 |
| 2024 | $8,343 | $223,800 | $31,300 | $192,500 |
| 2022 | $8,361 | $223,800 | $31,300 | $192,500 |
| 2021 | $6,770 | $181,300 | $31,300 | $150,000 |
| 2020 | $6,889 | $181,300 | $31,300 | $150,000 |
| 2019 | $5,856 | $155,700 | $31,300 | $124,400 |
| 2018 | $5,750 | $155,700 | $31,300 | $124,400 |
| 2017 | $5,543 | $155,700 | $31,300 | $124,400 |
| 2016 | $5,356 | $155,700 | $31,300 | $124,400 |
| 2015 | $5,152 | $155,700 | $31,300 | $124,400 |
| 2014 | $4,828 | $155,700 | $31,300 | $124,400 |
Source: Public Records
Map
Nearby Homes
- 431-433 S 18th St
- 431-433 S 18th St Unit 4
- 408-410 S 19th St
- 392 S 19th St
- 369 14th Ave
- 413 S 16th St
- 440 S 16th St
- 407 S 15th St Unit 409
- 407-409 S 15th St
- 553 S Orange Ave
- 369 S 19th St
- 406 S 15th St
- 500 S 20th St Unit 502
- 502 S 20th St
- 3-5 Ferdinand St
- 356 S 19th St
- 443 Grove St
- 431 S 14th St
- 359 S 20th St Unit 361
- 543 13th Ave
- 429 S 18th St
- 429 S 18th St Unit 2
- 427 S 18th St
- 425 S 18th St
- 423 S 18th St
- 423 S 18th St Unit 2
- 432 S 19th St
- 434 S 19th St
- 430 S 19th St
- 436 S 19th St
- 426-428 S 19th St
- 426-428 S 19th St Unit 1
- 439 S 18th St
- 438 S 19th St
- 440 S 19th St
- 424 S 19th St
- 417 S 18th St Unit 419
- 441 S 18th St
- 428 S 18th St
- 426 S 18th St