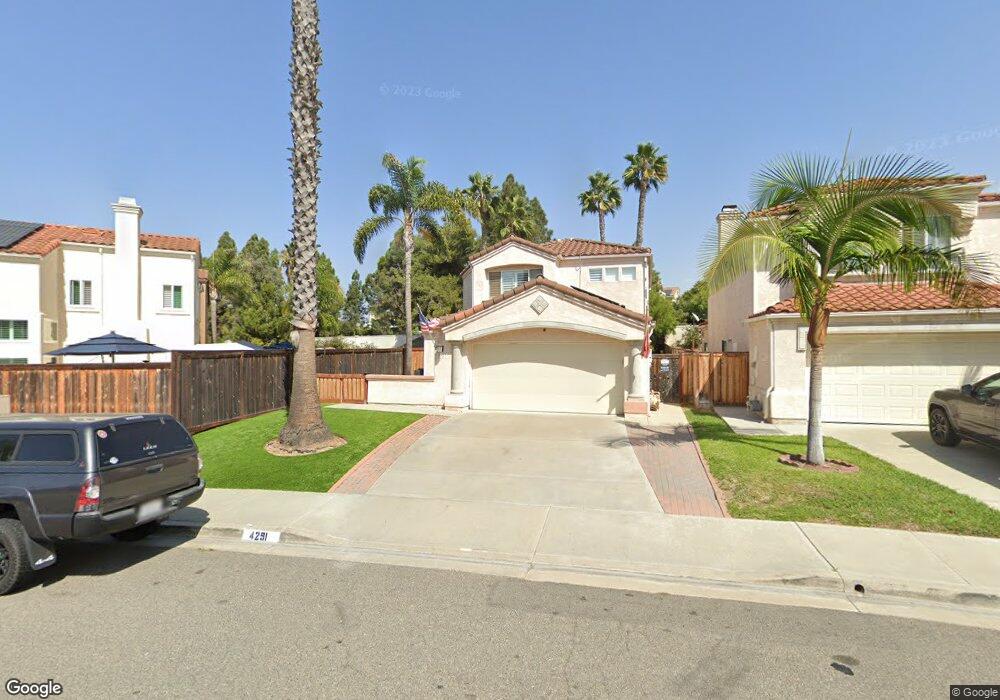
4291 Conquistador Oceanside, CA 92056
Ivey Ranch-Rancho Del Oro NeighborhoodEstimated Value: $975,000 - $997,515
5
Beds
3
Baths
2,246
Sq Ft
$440/Sq Ft
Est. Value
About This Home
This home is located at 4291 Conquistador, Oceanside, CA 92056 and is currently estimated at $988,879, approximately $440 per square foot. 4291 Conquistador is a home located in San Diego County with nearby schools including Ivey Ranch Elementary School, Martin Luther King Jr. Middle School, and El Camino High School.
Ownership History
Date
Name
Owned For
Owner Type
Purchase Details
Closed on
Jan 10, 2022
Sold by
Eduardo Garcia Jr and Eduardo Leia Alexandria
Bought by
Garcia Eduardo and Garcia Alexandria Leia
Current Estimated Value
Home Financials for this Owner
Home Financials are based on the most recent Mortgage that was taken out on this home.
Original Mortgage
$725,200
Outstanding Balance
$662,296
Interest Rate
3.05%
Mortgage Type
VA
Estimated Equity
$326,583
Purchase Details
Closed on
Sep 24, 2020
Sold by
Barding Bradford Huyett
Bought by
Garcia Eduardo and Galvez Alexandria Leia
Home Financials for this Owner
Home Financials are based on the most recent Mortgage that was taken out on this home.
Original Mortgage
$662,904
Interest Rate
2.9%
Mortgage Type
VA
Purchase Details
Closed on
Jan 16, 2020
Sold by
Barding Bradford Huyett
Bought by
Barding Bradford Huyett
Purchase Details
Closed on
Sep 20, 1990
Bought by
Barding Living Trust 08-03-90
Create a Home Valuation Report for This Property
The Home Valuation Report is an in-depth analysis detailing your home's value as well as a comparison with similar homes in the area
Home Values in the Area
Average Home Value in this Area
Purchase History
| Date | Buyer | Sale Price | Title Company |
|---|---|---|---|
| Garcia Eduardo | -- | None Listed On Document | |
| Garcia Eduardo | -- | None Listed On Document | |
| Garcia Eduardo | $648,000 | Fidelity National Title Co | |
| Barding Bradford Huyett | -- | None Available | |
| Barding Living Trust 08-03-90 | $203,900 | -- |
Source: Public Records
Mortgage History
| Date | Status | Borrower | Loan Amount |
|---|---|---|---|
| Open | Garcia Eduardo | $725,200 | |
| Previous Owner | Garcia Eduardo | $662,904 |
Source: Public Records
Tax History
| Year | Tax Paid | Tax Assessment Tax Assessment Total Assessment is a certain percentage of the fair market value that is determined by local assessors to be the total taxable value of land and additions on the property. | Land | Improvement |
|---|---|---|---|---|
| 2025 | $7,884 | $701,413 | $248,422 | $452,991 |
| 2024 | $7,734 | $687,660 | $243,551 | $444,109 |
| 2023 | $7,496 | $674,177 | $238,776 | $435,401 |
| 2022 | $7,382 | $660,959 | $234,095 | $426,864 |
| 2021 | $7,411 | $648,000 | $229,505 | $418,495 |
| 2020 | $1,577 | $144,869 | $51,309 | $93,560 |
| 2019 | $1,531 | $142,029 | $50,303 | $91,726 |
| 2018 | $1,519 | $139,245 | $49,317 | $89,928 |
| 2017 | $1,490 | $136,515 | $48,350 | $88,165 |
| 2016 | $1,440 | $133,839 | $47,402 | $86,437 |
| 2015 | $1,398 | $131,829 | $46,690 | $85,139 |
| 2014 | $1,344 | $129,248 | $45,776 | $83,472 |
Source: Public Records
Map
Nearby Homes
- 1528 Via Otano
- 4236 Conquistador
- 1607 Via Otano
- 1593 Avenida Guillermo
- 1571 Corte Daniel
- 1278 Via Fanal
- 1309 Via Lucero
- 1291 Via Lucero
- 1560 Via Botero
- 1251 Via Lucero
- 1191 Via Lucero
- 1162 Via Sandia
- 1118 Via Lucero
- 1424 Calle Marbella
- 1275 Natoma Way Unit B
- 1034 Turnstone Way
- 4382 Pacifica Way Unit 4
- 1029 Turnstone Way
- 4367 Pacifica Way Unit 2
- 1137 Avenida Sobrina
- 4287 Conquistador
- 1555 Corte de Mija
- 1551 Corte de Mija
- 4283 Conquistador
- 1559 Corte de Mija
- 4279 Conquistador
- 1563 Corte de Mija
- 4288 Conquistador
- 4292 Conquistador
- 4275 Conquistador
- 4280 Conquistador
- 4296 Conquistador
- 1567 Corte de Mija
- 4271 Conquistador
- 4708 Via Escala
- 4276 Conquistador
- 1550 Corte de Mija
- 4300 Conquistador
- 1571 Corte de Mija
- 4267 Conquistador
Your Personal Tour Guide
Ask me questions while you tour the home.