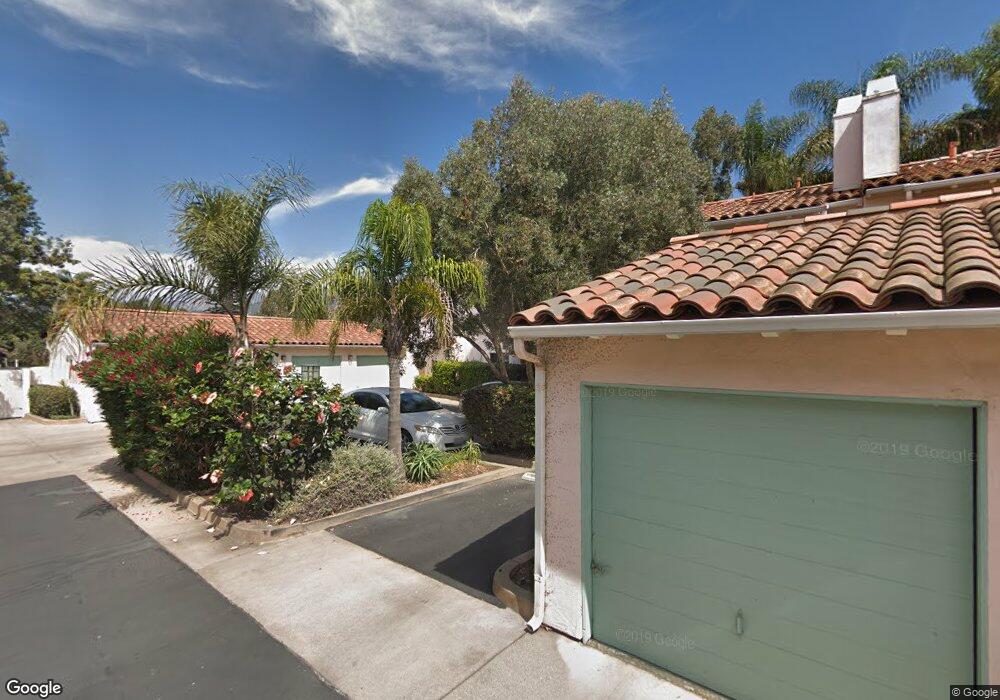
4297 Carpinteria Ave Unit 18 Carpinteria, CA 93013
Old Town Carpinteria NeighborhoodEstimated Value: $838,000 - $1,034,000
2
Beds
2
Baths
1,088
Sq Ft
$840/Sq Ft
Est. Value
About This Home
This home is located at 4297 Carpinteria Ave Unit 18, Carpinteria, CA 93013 and is currently estimated at $914,017, approximately $840 per square foot. 4297 Carpinteria Ave Unit 18 is a home located in Santa Barbara County with nearby schools including Carpinteria Senior High School and The Howard School.
Ownership History
Date
Name
Owned For
Owner Type
Purchase Details
Closed on
Jun 13, 2022
Sold by
Aten Christopher J and Aten Jessica L
Bought by
Marks Revocable Living Trust
Current Estimated Value
Home Financials for this Owner
Home Financials are based on the most recent Mortgage that was taken out on this home.
Original Mortgage
$360,000
Outstanding Balance
$340,511
Interest Rate
5.25%
Mortgage Type
New Conventional
Estimated Equity
$573,506
Purchase Details
Closed on
Feb 8, 2018
Sold by
Coffman Dennis and Coffman Dorothy
Bought by
Aten Christopher J and Aten Jessica L
Home Financials for this Owner
Home Financials are based on the most recent Mortgage that was taken out on this home.
Original Mortgage
$454,000
Interest Rate
3.99%
Mortgage Type
New Conventional
Create a Home Valuation Report for This Property
The Home Valuation Report is an in-depth analysis detailing your home's value as well as a comparison with similar homes in the area
Home Values in the Area
Average Home Value in this Area
Purchase History
| Date | Buyer | Sale Price | Title Company |
|---|---|---|---|
| Marks Revocable Living Trust | $800,000 | Chicago Title | |
| Aten Christopher J | $567,500 | Chicago Title Co |
Source: Public Records
Mortgage History
| Date | Status | Borrower | Loan Amount |
|---|---|---|---|
| Open | Marks Revocable Living Trust | $360,000 | |
| Previous Owner | Aten Christopher J | $454,000 |
Source: Public Records
Tax History
| Year | Tax Paid | Tax Assessment Tax Assessment Total Assessment is a certain percentage of the fair market value that is determined by local assessors to be the total taxable value of land and additions on the property. | Land | Improvement |
|---|---|---|---|---|
| 2025 | $9,452 | $832,320 | $416,160 | $416,160 |
| 2023 | $9,452 | $800,000 | $400,000 | $400,000 |
| 2022 | $7,171 | $608,472 | $304,236 | $304,236 |
| 2021 | $7,011 | $596,542 | $298,271 | $298,271 |
| 2020 | $6,920 | $590,426 | $295,213 | $295,213 |
| 2019 | $6,770 | $578,850 | $289,425 | $289,425 |
| 2018 | $3,773 | $295,205 | $142,650 | $152,555 |
| 2017 | $3,693 | $289,417 | $139,853 | $149,564 |
| 2016 | $3,628 | $283,743 | $137,111 | $146,632 |
| 2015 | $3,593 | $279,482 | $135,052 | $144,430 |
| 2014 | $3,391 | $274,008 | $132,407 | $141,601 |
Source: Public Records
Map
Nearby Homes
- 4264 Carpinteria Ave Unit 5
- 910 Pear St
- 4501 Carpinteria Ave Unit C
- 4420 Catlin Cir Unit C
- 349 Ash Ave Unit Spc 17
- 349 Ash Ave Unit 45
- 4631 Carpinteria Ave
- 1230 Franciscan Ct Unit 7
- 4731 4th St
- 1255 Franciscan Ct Unit 1
- 4677 Carpinteria Ave Unit P
- 1260 Cravens Ln Unit 2
- 571 Sand Point Rd
- 4725 9th St Unit 31
- 4700 Sandyland Rd Unit 23
- 180 Holly Ave
- 635 Elm Ave Unit 1
- 220 Elm Ave Unit 9
- 3950 Via Real Unit Spc 239
- 3950 Via Real Unit Spc 24
- 4297 Carpinteria Ave Unit 19
- 4297 Carpinteria Ave Unit 15
- 4297 Carpinteria Ave Unit 1
- 4297 Carpinteria Ave Unit 10
- 4297 Carpinteria Ave Unit 16
- 4297 Carpinteria Ave
- 4297 Carpinteria Ave Unit 6
- 4297 Carpinteria Ave Unit 12
- 4297 Carpinteria Ave
- 4297 Carpinteria Ave
- 4297 Carpinteria Ave
- 4297 Carpinteria Ave
- 4297 Carpinteria Ave Unit 19
- 4297 Carpinteria Ave Unit 18
- 4297 Carpinteria Ave Unit 17
- 4297 Carpinteria Ave Unit 16
- 4297 Carpinteria Ave Unit 15
- 4297 Carpinteria Ave Unit 14
- 4297 Carpinteria Ave Unit 13
- 4297 Carpinteria Ave Unit 12
Your Personal Tour Guide
Ask me questions while you tour the home.