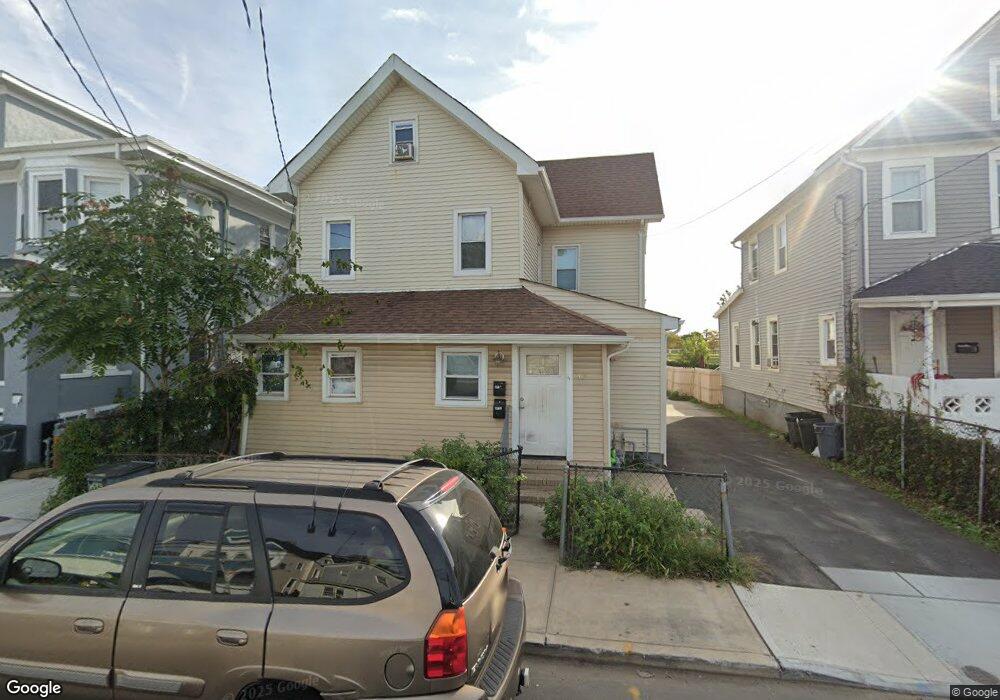
43 2nd Ave Long Branch, NJ 07740
Estimated Value: $690,344 - $948,000
3
Beds
2
Baths
1,962
Sq Ft
$423/Sq Ft
Est. Value
About This Home
This home is located at 43 2nd Ave, Long Branch, NJ 07740 and is currently estimated at $829,836, approximately $422 per square foot. 43 2nd Ave is a home located in Monmouth County with nearby schools including Long Branch High School and Holy Trinity School.
Ownership History
Date
Name
Owned For
Owner Type
Purchase Details
Closed on
Jan 29, 2019
Sold by
Kapelushink Mark
Bought by
43 2Nd St Llc
Current Estimated Value
Purchase Details
Closed on
Aug 21, 2018
Sold by
43 2Nd St Llc
Bought by
Kapelushnik Mark
Purchase Details
Closed on
Aug 28, 2017
Sold by
Kapelushnik Mark
Bought by
43 2Nd St Llc
Purchase Details
Closed on
Feb 20, 2004
Sold by
Gonzalez Felipe
Bought by
Kapelushnik Mark
Home Financials for this Owner
Home Financials are based on the most recent Mortgage that was taken out on this home.
Original Mortgage
$180,000
Interest Rate
5.65%
Mortgage Type
Commercial
Purchase Details
Closed on
Apr 18, 2000
Sold by
Lopes Armindo
Bought by
Gonzalez Carmina
Home Financials for this Owner
Home Financials are based on the most recent Mortgage that was taken out on this home.
Original Mortgage
$85,500
Interest Rate
8.21%
Mortgage Type
Commercial
Create a Home Valuation Report for This Property
The Home Valuation Report is an in-depth analysis detailing your home's value as well as a comparison with similar homes in the area
Home Values in the Area
Average Home Value in this Area
Purchase History
| Date | Buyer | Sale Price | Title Company |
|---|---|---|---|
| 43 2Nd St Llc | $132,000 | Dekel Abstract Llc | |
| Kapelushnik Mark | -- | None Available | |
| 43 2Nd St Llc | $125,000 | -- | |
| Kapelushnik Mark | $240,000 | -- | |
| Gonzalez Carmina | $94,000 | -- |
Source: Public Records
Mortgage History
| Date | Status | Borrower | Loan Amount |
|---|---|---|---|
| Previous Owner | Kapelushnik Mark | $180,000 | |
| Previous Owner | Gonzalez Carmina | $85,500 |
Source: Public Records
Tax History
| Year | Tax Paid | Tax Assessment Tax Assessment Total Assessment is a certain percentage of the fair market value that is determined by local assessors to be the total taxable value of land and additions on the property. | Land | Improvement |
|---|---|---|---|---|
| 2025 | $7,367 | $534,700 | $242,200 | $292,500 |
| 2024 | $6,633 | $479,300 | $212,200 | $267,100 |
| 2023 | $6,633 | $427,100 | $172,200 | $254,900 |
| 2022 | $6,179 | $361,800 | $137,200 | $224,600 |
| 2021 | $6,179 | $308,800 | $118,200 | $190,600 |
| 2020 | $6,410 | $306,700 | $117,200 | $189,500 |
| 2019 | $6,052 | $287,900 | $107,200 | $180,700 |
| 2018 | $5,778 | $273,300 | $99,200 | $174,100 |
| 2017 | $5,317 | $258,000 | $87,200 | $170,800 |
| 2016 | $5,226 | $258,600 | $92,200 | $166,400 |
| 2015 | $4,942 | $221,900 | $93,400 | $128,500 |
| 2014 | $4,627 | $219,000 | $105,000 | $114,000 |
Source: Public Records
Map
Nearby Homes
- 167 Chelsea Ave
- 20 Melrose Terrace Unit 407
- 20 Melrose Terrace Unit 408
- 30 Melrose Terrace Unit 208
- 30 Melrose Terrace Unit 609
- 30 Melrose Terrace Unit 218
- 15 Morris Ave Unit 609
- 15 Morris Ave Unit 525
- 15 Morris Ave Unit 202
- 15 Morris Ave Unit 310
- 15 Morris Ave Unit 505
- 171 2nd Ave
- 150 Franklin Ave Unit 5
- 175 2nd Ave
- 22 Cooper Ave Unit 110
- 162 Franklin Ave Unit 2
- 168 Franklin Ave
- 170 Franklin Ave
- 40 N 5th Ave
- 236 Seaview Ave
Your Personal Tour Guide
Ask me questions while you tour the home.