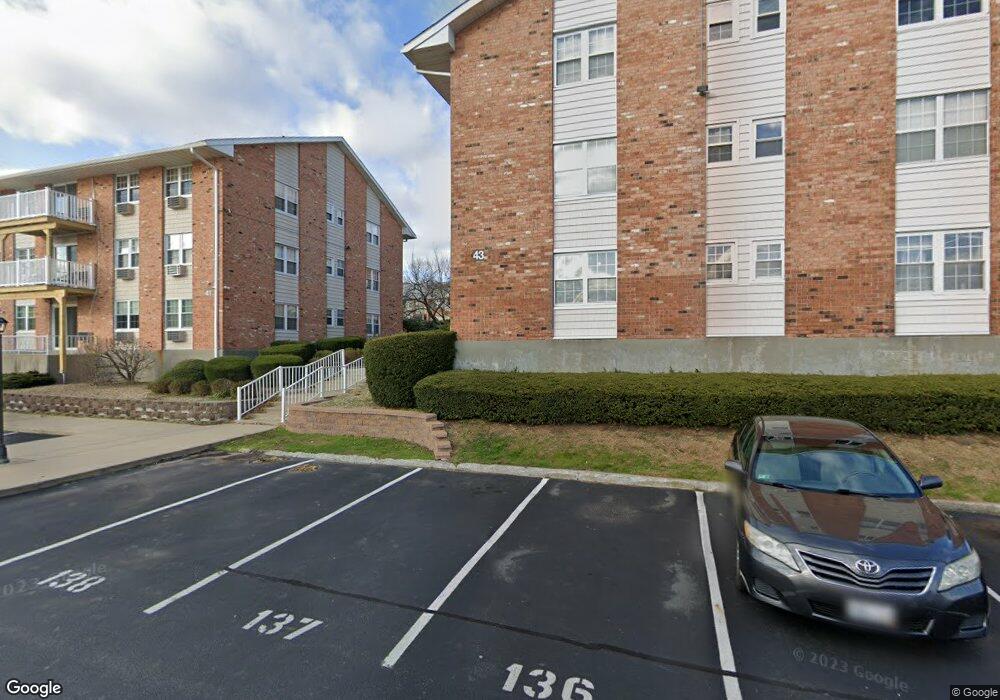
43 Bullocks Point Ave Unit 2B Riverside, RI 02915
Riverside NeighborhoodEstimated Value: $270,000 - $320,000
2
Beds
2
Baths
1,000
Sq Ft
$302/Sq Ft
Est. Value
About This Home
This home is located at 43 Bullocks Point Ave Unit 2B, Riverside, RI 02915 and is currently estimated at $302,201, approximately $302 per square foot. 43 Bullocks Point Ave Unit 2B is a home located in Providence County with nearby schools including East Providence High School, St Mary Academy-Bay View, and The Gordon School.
Ownership History
Date
Name
Owned For
Owner Type
Purchase Details
Closed on
May 29, 1992
Sold by
Suzman Maynard F
Bought by
Grant Mary L
Current Estimated Value
Home Financials for this Owner
Home Financials are based on the most recent Mortgage that was taken out on this home.
Original Mortgage
$45,000
Interest Rate
8.7%
Create a Home Valuation Report for This Property
The Home Valuation Report is an in-depth analysis detailing your home's value as well as a comparison with similar homes in the area
Home Values in the Area
Average Home Value in this Area
Purchase History
| Date | Buyer | Sale Price | Title Company |
|---|---|---|---|
| Grant Mary L | $57,000 | -- |
Source: Public Records
Mortgage History
| Date | Status | Borrower | Loan Amount |
|---|---|---|---|
| Open | Grant Mary L | $41,600 | |
| Open | Grant Mary L | $85,500 | |
| Closed | Grant Mary L | $10,000 | |
| Closed | Grant Mary L | $45,000 |
Source: Public Records
Tax History Compared to Growth
Tax History
| Year | Tax Paid | Tax Assessment Tax Assessment Total Assessment is a certain percentage of the fair market value that is determined by local assessors to be the total taxable value of land and additions on the property. | Land | Improvement |
|---|---|---|---|---|
| 2025 | $3,232 | $247,300 | $0 | $247,300 |
| 2024 | $3,103 | $202,400 | $0 | $202,400 |
| 2023 | $2,987 | $202,400 | $0 | $202,400 |
| 2022 | $2,859 | $130,800 | $0 | $130,800 |
| 2021 | $2,825 | $131,400 | $0 | $131,400 |
| 2020 | $2,706 | $131,400 | $0 | $131,400 |
| 2019 | $2,631 | $131,400 | $0 | $131,400 |
| 2018 | $2,478 | $108,300 | $0 | $108,300 |
| 2017 | $2,423 | $108,300 | $0 | $108,300 |
| 2016 | $2,411 | $108,300 | $0 | $108,300 |
| 2015 | $2,543 | $110,800 | $0 | $110,800 |
| 2014 | $2,543 | $110,800 | $0 | $110,800 |
Source: Public Records
Map
Nearby Homes
- 25 Bullocks Point Ave Unit 5C
- 43 Bullocks Point Ave Unit 4C
- 31 Bullocks Point Ave Unit 2A
- 6 Fuller Ave
- 1 Fales St
- 3421 Pawtucket Ave
- 151 Willett Ave Unit 2
- 151 Willett Ave Unit 5
- 25 Arnold St
- 81 Sprague Ave
- 88 Lincoln Ave
- 57 Harris St
- 17 Oak Ave
- 33 Pine St Unit 35
- 1 Holly St
- 14 Waterview Ave Unit 16
- 129 Cedar Ave
- 25 Read St
- 87 Bluff St
- 93 Narragansett Ave
- 43 Bullocks Point Ave Unit 4A
- 43 Bullocks Point Ave Unit 6A
- 43 Bullocks Point Ave Unit 4B
- 43 Bullocks Point Ave Unit 6C
- 43 Bullocks Point Ave Unit 8C
- 43 Bullocks Point Ave Unit 8B
- 43 Bullocks Point Ave Unit 8A
- 43 Bullocks Point Ave Unit 6B
- 43 Bullocks Point Ave Unit 5C
- 43 Bullocks Point Ave Unit 2A
- 43 Bullocks Point Ave Unit 2C
- 43 Bullocks Point Ave Unit 43
- 43 Bullocks Point Ave Unit 1/8C
- 43 Bullocks Point Ave Unit 8C
- 45 Bullocks Point Ave Unit 3C
- 45 Bullocks Point Ave Unit 1C
- 45 Bullocks Point Ave Unit 7A
- 45 Bullocks Point Ave Unit 5A
- 45 Bullocks Point Ave Unit 7B
- 45 Bullocks Point Ave Unit 5B