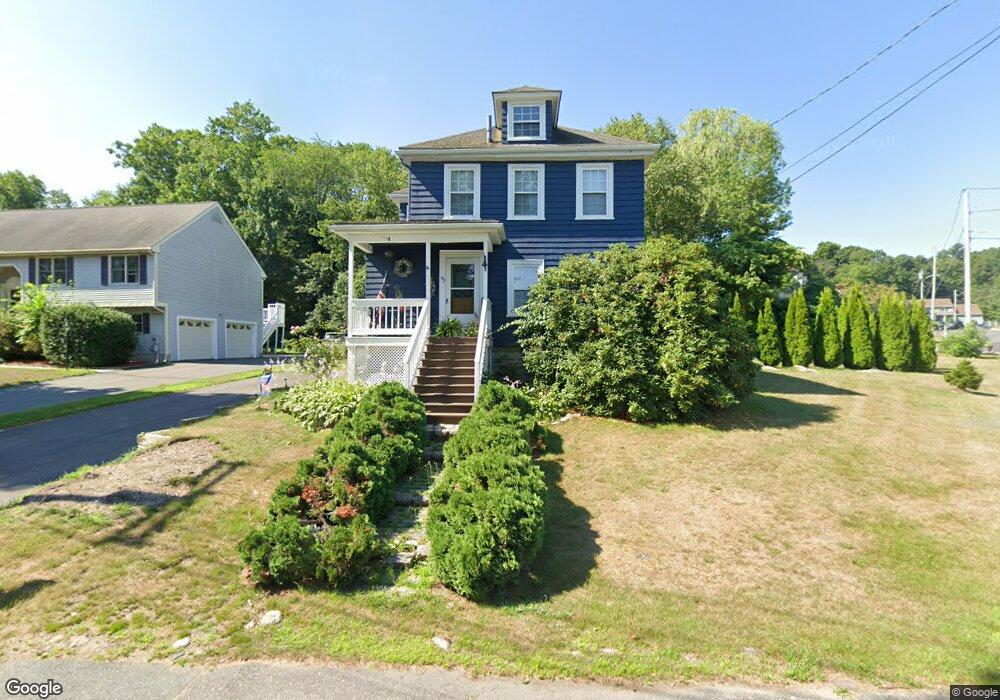
43 Courtland St Milford, MA 01757
Estimated Value: $447,000 - $505,000
3
Beds
1
Bath
1,262
Sq Ft
$367/Sq Ft
Est. Value
About This Home
This home is located at 43 Courtland St, Milford, MA 01757 and is currently estimated at $463,774, approximately $367 per square foot. 43 Courtland St is a home located in Worcester County with nearby schools including Milford High School, Bethany Christian Academy, and Mendon Mennonite School.
Ownership History
Date
Name
Owned For
Owner Type
Purchase Details
Closed on
Dec 16, 1997
Sold by
D&F Afonso Rt and Afonso Domingos
Bought by
White Christopher F and White Pamelia
Current Estimated Value
Home Financials for this Owner
Home Financials are based on the most recent Mortgage that was taken out on this home.
Original Mortgage
$112,729
Interest Rate
7.14%
Mortgage Type
Purchase Money Mortgage
Create a Home Valuation Report for This Property
The Home Valuation Report is an in-depth analysis detailing your home's value as well as a comparison with similar homes in the area
Home Values in the Area
Average Home Value in this Area
Purchase History
| Date | Buyer | Sale Price | Title Company |
|---|---|---|---|
| White Christopher F | $114,000 | -- |
Source: Public Records
Mortgage History
| Date | Status | Borrower | Loan Amount |
|---|---|---|---|
| Open | White Christopher F | $130,000 | |
| Closed | White Christopher F | $112,729 |
Source: Public Records
Tax History Compared to Growth
Tax History
| Year | Tax Paid | Tax Assessment Tax Assessment Total Assessment is a certain percentage of the fair market value that is determined by local assessors to be the total taxable value of land and additions on the property. | Land | Improvement |
|---|---|---|---|---|
| 2025 | $4,719 | $368,700 | $186,000 | $182,700 |
| 2024 | $4,569 | $343,800 | $178,500 | $165,300 |
| 2023 | $4,478 | $309,900 | $154,400 | $155,500 |
| 2022 | $4,382 | $284,700 | $141,300 | $143,400 |
| 2021 | $4,152 | $259,800 | $141,300 | $118,500 |
| 2020 | $4,110 | $257,500 | $141,300 | $116,200 |
| 2019 | $3,826 | $231,300 | $141,300 | $90,000 |
| 2018 | $3,769 | $227,600 | $137,600 | $90,000 |
| 2017 | $3,625 | $215,900 | $137,600 | $78,300 |
| 2016 | $3,613 | $210,300 | $137,600 | $72,700 |
| 2015 | $3,561 | $202,900 | $130,200 | $72,700 |
Source: Public Records
Map
Nearby Homes
- 7 Howard St
- The Brooklyn Plan at Harmony - Subdivision
- The Meadow Plan at Harmony - Subdivision
- The Layla Plan at Harmony - Subdivision
- The Ashley Plan at Harmony - Subdivision
- The Everleigh Plan at Harmony - Subdivision
- The Tucker Plan at Harmony - Subdivision
- The Iris Plan at Harmony - Subdivision
- 3 Pouliot St Unit 3
- 3 Birch Cir
- 211A S Main St
- 29 Harmony Trail
- 11 Heron Ln
- 30 Whitney St
- 7 Ariana Cir Unit 7
- 9 Ariana Cir Unit 9
- 29 Forest St
- 6 1/2 Leonard St
- 116 Adin St
- 318 Main St