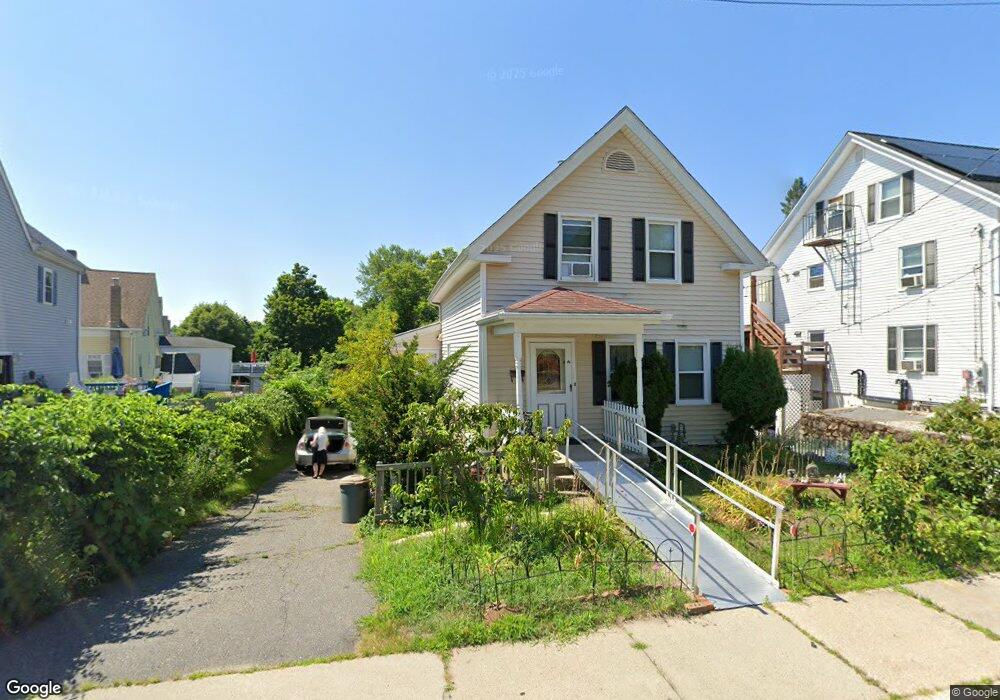
43 Fruit St Milford, MA 01757
Estimated Value: $346,000 - $377,703
2
Beds
1
Bath
876
Sq Ft
$407/Sq Ft
Est. Value
About This Home
This home is located at 43 Fruit St, Milford, MA 01757 and is currently estimated at $356,926, approximately $407 per square foot. 43 Fruit St is a home located in Worcester County with nearby schools including Milford High School and Bethany Christian Academy.
Ownership History
Date
Name
Owned For
Owner Type
Purchase Details
Closed on
May 30, 2013
Sold by
Dias Fernando
Bought by
Fernando Dias Ft and Dias Arminda
Current Estimated Value
Purchase Details
Closed on
Oct 3, 2008
Sold by
Dias Arminda
Bought by
Dias Fernando
Purchase Details
Closed on
Jan 3, 1991
Sold by
Whitewood Dev Corp
Bought by
Dias Florentino and Arminda Dias
Home Financials for this Owner
Home Financials are based on the most recent Mortgage that was taken out on this home.
Original Mortgage
$94,400
Interest Rate
9.83%
Mortgage Type
Purchase Money Mortgage
Purchase Details
Closed on
Sep 3, 1987
Sold by
Edwards Alan R
Bought by
Whitewood Dev Corp
Home Financials for this Owner
Home Financials are based on the most recent Mortgage that was taken out on this home.
Original Mortgage
$106,000
Interest Rate
10.28%
Mortgage Type
Purchase Money Mortgage
Create a Home Valuation Report for This Property
The Home Valuation Report is an in-depth analysis detailing your home's value as well as a comparison with similar homes in the area
Home Values in the Area
Average Home Value in this Area
Purchase History
| Date | Buyer | Sale Price | Title Company |
|---|---|---|---|
| Fernando Dias Ft | -- | -- | |
| Dias Fernando | -- | -- | |
| Dias Fernando | -- | -- | |
| Dias Florentino | $104,900 | -- | |
| Whitewood Dev Corp | $132,500 | -- |
Source: Public Records
Mortgage History
| Date | Status | Borrower | Loan Amount |
|---|---|---|---|
| Previous Owner | Whitewood Dev Corp | $90,000 | |
| Previous Owner | Whitewood Dev Corp | $94,400 | |
| Previous Owner | Whitewood Dev Corp | $106,000 |
Source: Public Records
Tax History Compared to Growth
Tax History
| Year | Tax Paid | Tax Assessment Tax Assessment Total Assessment is a certain percentage of the fair market value that is determined by local assessors to be the total taxable value of land and additions on the property. | Land | Improvement |
|---|---|---|---|---|
| 2025 | $4,275 | $334,000 | $199,500 | $134,500 |
| 2024 | $4,158 | $312,900 | $190,800 | $122,100 |
| 2023 | $3,998 | $276,700 | $161,800 | $114,900 |
| 2022 | $3,918 | $254,600 | $148,700 | $105,900 |
| 2021 | $3,781 | $236,600 | $148,700 | $87,900 |
| 2020 | $3,749 | $234,900 | $148,700 | $86,200 |
| 2019 | $3,583 | $216,600 | $148,700 | $67,900 |
| 2018 | $3,479 | $210,100 | $142,200 | $67,900 |
| 2017 | $3,380 | $201,300 | $142,200 | $59,100 |
| 2016 | $3,163 | $184,100 | $129,100 | $55,000 |
| 2015 | $3,155 | $179,800 | $124,800 | $55,000 |
Source: Public Records
Map
Nearby Homes
- 29 Forest St
- 20-22 Chapin St
- 7 Ariana Cir Unit 7
- 9 Ariana Cir Unit 9
- 6 1/2 Leonard St
- 3 Pouliot St Unit 3
- 30 Whitney St
- 33 Chestnut St
- 318 Main St
- 48 Claflin St
- 10-12 Orchard St
- 19 Oliver St
- 116 Adin St
- 56 S Bow St
- 106 Adin St
- 102-104 Central St
- 6 Correia Cir Unit B
- 55 Jefferson St
- 3 Birch Cir
- 57 Beach St
- 65 S Main St
- 41 Fruit St
- 61 Fruit St Unit A
- 67 S Main St
- 67 S Main St Unit 2
- 67 S Main St Unit 1
- 44 Fruit St Unit B
- 44 Fruit St Unit A
- 39 Fruit St
- 72 Fruit St
- 68 Fruit St
- 69 S Main St
- 61 S Main St
- 37 Fruit St
- 37 Fruit St Unit 1
- 37 Fruit St Unit 2
- 36 Fruit St
- 64 S Main St
- 66 S Main St
- 66 S Main St Unit 66