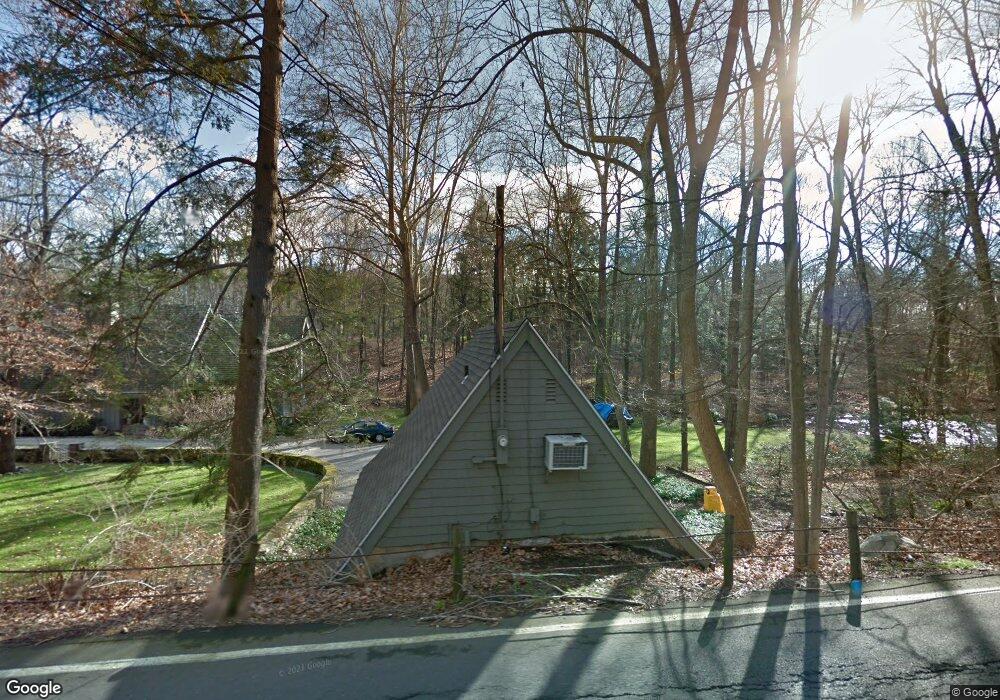
43 Good Hill Rd Weston, CT 06883
Estimated Value: $1,198,000 - $1,929,000
1
Bed
1
Bath
650
Sq Ft
$2,247/Sq Ft
Est. Value
About This Home
This home is located at 43 Good Hill Rd, Weston, CT 06883 and is currently estimated at $1,460,534, approximately $2,246 per square foot. 43 Good Hill Rd is a home located in Fairfield County with nearby schools including Hurlbutt Elementary School, Weston Intermediate School, and Weston Middle School.
Ownership History
Date
Name
Owned For
Owner Type
Purchase Details
Closed on
Aug 19, 2021
Sold by
Goldstein Francine
Bought by
Francine E Goldstein Rt
Current Estimated Value
Purchase Details
Closed on
Jun 30, 2009
Sold by
Weichert Relocation In
Bought by
Golstein Francine
Purchase Details
Closed on
Aug 18, 2008
Sold by
Behrens William P and Moore-Behrens Diane
Bought by
Nerris Susan M
Home Financials for this Owner
Home Financials are based on the most recent Mortgage that was taken out on this home.
Original Mortgage
$640,500
Interest Rate
6.4%
Mortgage Type
Purchase Money Mortgage
Purchase Details
Closed on
Sep 2, 1992
Sold by
Hayes Walter V and Hayes Maryellen
Bought by
Gaul Robin and Gaul Violet
Create a Home Valuation Report for This Property
The Home Valuation Report is an in-depth analysis detailing your home's value as well as a comparison with similar homes in the area
Home Values in the Area
Average Home Value in this Area
Purchase History
| Date | Buyer | Sale Price | Title Company |
|---|---|---|---|
| Francine E Goldstein Rt | -- | None Available | |
| Golstein Francine | $810,000 | -- | |
| Weichert Relocation In | $830,000 | -- | |
| Nerris Susan M | $915,000 | -- | |
| Gaul Robin | $265,000 | -- |
Source: Public Records
Mortgage History
| Date | Status | Borrower | Loan Amount |
|---|---|---|---|
| Previous Owner | Gaul Robin | $640,500 | |
| Previous Owner | Gaul Robin | $600,000 | |
| Previous Owner | Gaul Robin | $431,250 |
Source: Public Records
Tax History Compared to Growth
Tax History
| Year | Tax Paid | Tax Assessment Tax Assessment Total Assessment is a certain percentage of the fair market value that is determined by local assessors to be the total taxable value of land and additions on the property. | Land | Improvement |
|---|---|---|---|---|
| 2025 | $15,494 | $648,270 | $259,140 | $389,130 |
| 2024 | $15,215 | $648,270 | $259,140 | $389,130 |
| 2023 | $15,474 | $468,060 | $259,180 | $208,880 |
| 2022 | $15,432 | $468,060 | $259,180 | $208,880 |
| 2021 | $15,409 | $468,060 | $259,180 | $208,880 |
| 2020 | $15,151 | $468,060 | $259,180 | $208,880 |
| 2019 | $15,151 | $468,060 | $259,180 | $208,880 |
| 2018 | $14,278 | $485,800 | $267,700 | $218,100 |
| 2017 | $14,044 | $485,800 | $267,700 | $218,100 |
| 2016 | $13,874 | $485,800 | $267,700 | $218,100 |
| 2015 | $13,928 | $485,800 | $267,700 | $218,100 |
| 2014 | $13,719 | $485,800 | $267,700 | $218,100 |
Source: Public Records
Map
Nearby Homes
- 4 Good Hill Rd
- 32 Kettle Creek Rd
- 17 Huckleberry Ln
- 31 Riverfield Dr
- 31 White Birch Rd
- 1 Greenlea Ln
- 81 Norfield Rd
- 136 Lyons Plain Rd
- 145 Lyons Plain Rd
- 24 Nordholm Dr
- 8 Hedgerow Common
- 30 Cavalry Rd
- 9 Greenbrier Rd
- 214 Good Hill Rd
- 40 Hermit Ln
- 14 Northfield Dr
- 4A Newtown Turnpike
- 25 Hermit Ln
- 93 E Meadow Rd
- 18 Hunt Ln