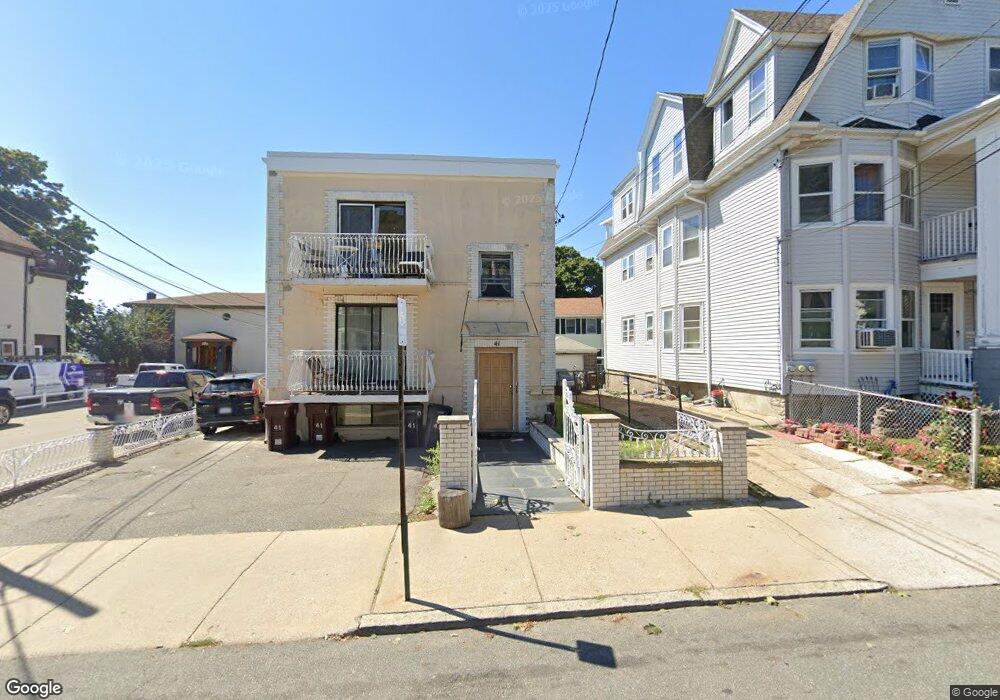
43 High St Everett, MA 02149
Downtown Everett NeighborhoodEstimated Value: $752,000 - $832,555
4
Beds
3
Baths
2,152
Sq Ft
$372/Sq Ft
Est. Value
About This Home
This home is located at 43 High St, Everett, MA 02149 and is currently estimated at $800,889, approximately $372 per square foot. 43 High St is a home located in Middlesex County with nearby schools including Everett High School and Pioneer Charter School of Science.
Ownership History
Date
Name
Owned For
Owner Type
Purchase Details
Closed on
May 27, 2022
Sold by
Hickey James E and Hickey Sharyn M
Bought by
Hickey 43 High St T
Current Estimated Value
Purchase Details
Closed on
Jan 8, 2019
Sold by
Hickey James E and Hickey Sharyn M
Bought by
Hickey James E and Hickey Sharyn M
Purchase Details
Closed on
Jan 1, 1982
Bought by
Hickey James E
Create a Home Valuation Report for This Property
The Home Valuation Report is an in-depth analysis detailing your home's value as well as a comparison with similar homes in the area
Home Values in the Area
Average Home Value in this Area
Purchase History
| Date | Buyer | Sale Price | Title Company |
|---|---|---|---|
| Hickey 43 High St T | -- | None Available | |
| Hickey James E | -- | -- | |
| Hickey James E | -- | -- |
Source: Public Records
Mortgage History
| Date | Status | Borrower | Loan Amount |
|---|---|---|---|
| Previous Owner | Hickey James E | $20,000 | |
| Previous Owner | Hickey James E | $142,500 | |
| Previous Owner | Hickey James E | $94,400 |
Source: Public Records
Tax History
| Year | Tax Paid | Tax Assessment Tax Assessment Total Assessment is a certain percentage of the fair market value that is determined by local assessors to be the total taxable value of land and additions on the property. | Land | Improvement |
|---|---|---|---|---|
| 2025 | $8,233 | $722,800 | $259,000 | $463,800 |
| 2024 | $7,758 | $677,000 | $247,800 | $429,200 |
| 2023 | $7,552 | $641,100 | $230,900 | $410,200 |
| 2022 | $6,409 | $618,600 | $219,600 | $399,000 |
| 2021 | $5,616 | $569,000 | $199,900 | $369,100 |
| 2020 | $5,986 | $562,600 | $199,900 | $362,700 |
| 2019 | $6,504 | $525,400 | $186,400 | $339,000 |
| 2018 | $6,127 | $444,600 | $162,200 | $282,400 |
| 2017 | $5,802 | $401,800 | $135,100 | $266,700 |
| 2016 | $5,627 | $389,400 | $135,100 | $254,300 |
| 2015 | $5,448 | $372,900 | $120,800 | $252,100 |
Source: Public Records
Map
Nearby Homes
- 20 Fairmount St
- 110 Ferry St
- 21 Hillside Ave Unit 21
- 20 Ferry St Unit B
- 181 Chelsea St
- 99 Florence St
- 48 Cleveland Ave
- 15 Staples Ave Unit 45
- 15 Staples Ave Unit 31
- 68 Linden St Unit 49
- 21 Staples Ave Unit 26
- 24 Corey St Unit 101
- 21 Central Ave Unit 10
- 238 Chelsea St
- 55 Garland St
- 114 Francis St
- 132 Vernal St
- 139 Bucknam St
- 34 Paris St
- 210 Hancock St
- 45 High St
- 3 High Street Terrace
- 3 High Street Terrace Unit 2
- 14 Hampshire St
- 35 High St
- 12 Hampshire St
- 33 High St
- 16 Hampshire St Unit 3
- 16 Hampshire St Unit 1
- 41 High St
- 41 High St Unit B
- 29 High St
- 10 Hampshire St
- 18 Hampshire St
- 47 High St
- 4 High Street Terrace
- 20 Hampshire St
- 22 Hampshire St
- 51 High St
- 51 High St Unit 3
Your Personal Tour Guide
Ask me questions while you tour the home.