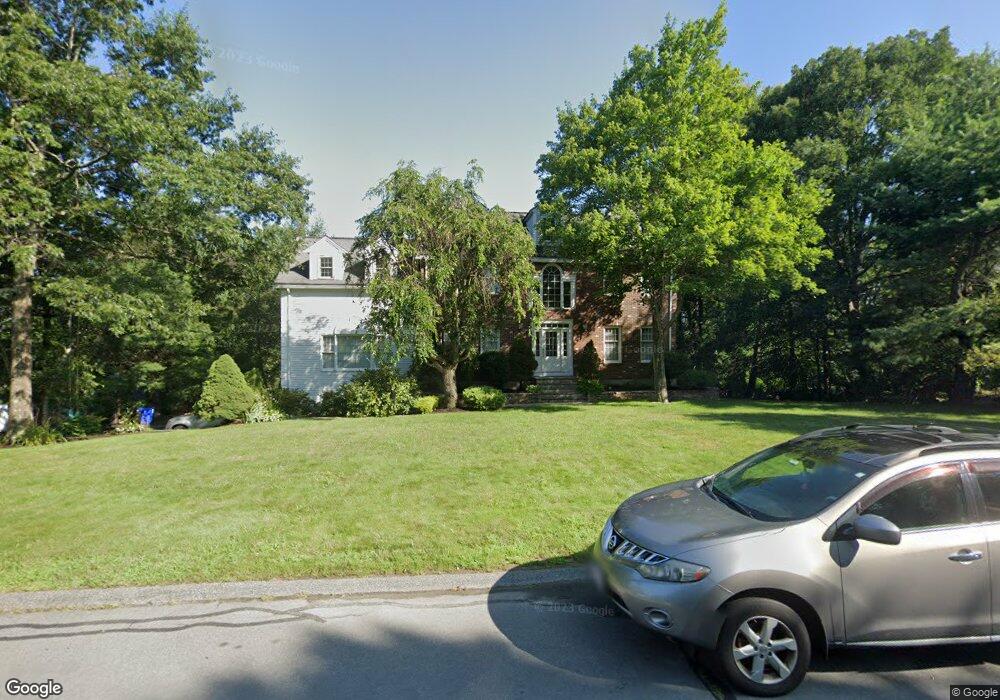
43 Highland View Dr Sutton, MA 01590
Estimated Value: $769,000 - $869,807
4
Beds
4
Baths
4,000
Sq Ft
$207/Sq Ft
Est. Value
About This Home
This home is located at 43 Highland View Dr, Sutton, MA 01590 and is currently estimated at $829,202, approximately $207 per square foot. 43 Highland View Dr is a home located in Worcester County with nearby schools including Sutton Elementary School, Sutton Middle School, and Sutton High School.
Ownership History
Date
Name
Owned For
Owner Type
Purchase Details
Closed on
Jul 30, 2007
Sold by
Harris Ann Marie and Harris Kevin M
Bought by
Pawlak Christy L and Pawlak Joseph W
Current Estimated Value
Home Financials for this Owner
Home Financials are based on the most recent Mortgage that was taken out on this home.
Original Mortgage
$412,000
Interest Rate
6.78%
Mortgage Type
Purchase Money Mortgage
Purchase Details
Closed on
Sep 30, 1994
Sold by
Hurley Sean M and Hurley Robin
Bought by
Harris Kevin M and Harris Ann M
Create a Home Valuation Report for This Property
The Home Valuation Report is an in-depth analysis detailing your home's value as well as a comparison with similar homes in the area
Home Values in the Area
Average Home Value in this Area
Purchase History
| Date | Buyer | Sale Price | Title Company |
|---|---|---|---|
| Pawlak Christy L | $515,000 | -- | |
| Harris Kevin M | $260,000 | -- |
Source: Public Records
Mortgage History
| Date | Status | Borrower | Loan Amount |
|---|---|---|---|
| Open | Harris Kevin M | $407,000 | |
| Closed | Pawlak Christy L | $412,000 | |
| Previous Owner | Harris Kevin M | $150,000 | |
| Previous Owner | Harris Kevin M | $215,500 |
Source: Public Records
Tax History
| Year | Tax Paid | Tax Assessment Tax Assessment Total Assessment is a certain percentage of the fair market value that is determined by local assessors to be the total taxable value of land and additions on the property. | Land | Improvement |
|---|---|---|---|---|
| 2025 | $9,372 | $752,200 | $207,900 | $544,300 |
| 2024 | $9,258 | $718,200 | $181,700 | $536,500 |
| 2023 | $8,984 | $638,100 | $164,200 | $473,900 |
| 2022 | $8,739 | $563,100 | $131,400 | $431,700 |
| 2021 | $3,320 | $521,800 | $131,400 | $390,400 |
| 2020 | $8,531 | $521,800 | $131,400 | $390,400 |
| 2019 | $8,139 | $479,900 | $126,600 | $353,300 |
| 2018 | $7,813 | $459,300 | $126,600 | $332,700 |
| 2017 | $7,659 | $451,600 | $110,600 | $341,000 |
| 2016 | $7,532 | $439,200 | $110,600 | $328,600 |
| 2015 | $7,230 | $422,800 | $110,600 | $312,200 |
| 2014 | $7,128 | $408,700 | $114,200 | $294,500 |
Source: Public Records
Map
Nearby Homes
- 5 Wildflower Dr
- 90 Leland Hill Rd
- 20 Millers Way Unit C
- 82 Central Turnpike
- 175 Armsby Rd
- 191 Hartness Rd
- 66 Buttonwood Ave
- 229 Worcester-Providence Turnpike
- 53 Fisherville Terrace
- 64 Fisherville Terrace
- 62 Fisherville Terrace
- 58 Fisherville Terrace
- 7 Central Turnpike
- 150 Ariel Cir
- 51 Lincoln Rd
- 9 Danielle Dr
- 20 Wunschel Dr
- 56 Luka Dr Unit 56
- 240 Roosevelt Dr
- 1 Burbank Rd
- 45 Highland View Dr
- 41 Highland View Dr
- 41 Highland View Dr Unit .
- 73 Highland View Dr
- 77 Highland View Dr
- 44 Highland View Dr
- 71 Highland View Dr
- 48 Highland View Dr
- 49 Highland View Dr
- 37 Highland View Dr
- 40 Highland View Dr
- 79 Highland View Dr
- 69 Highland View Dr
- 74 Highland View Dr
- 38 Highland View Dr
- 72 Highland View Dr
- 78 Highland View Dr
- 35 Highland View Dr
- 81 Highland View Dr
- 80 Highland View Dr
Your Personal Tour Guide
Ask me questions while you tour the home.