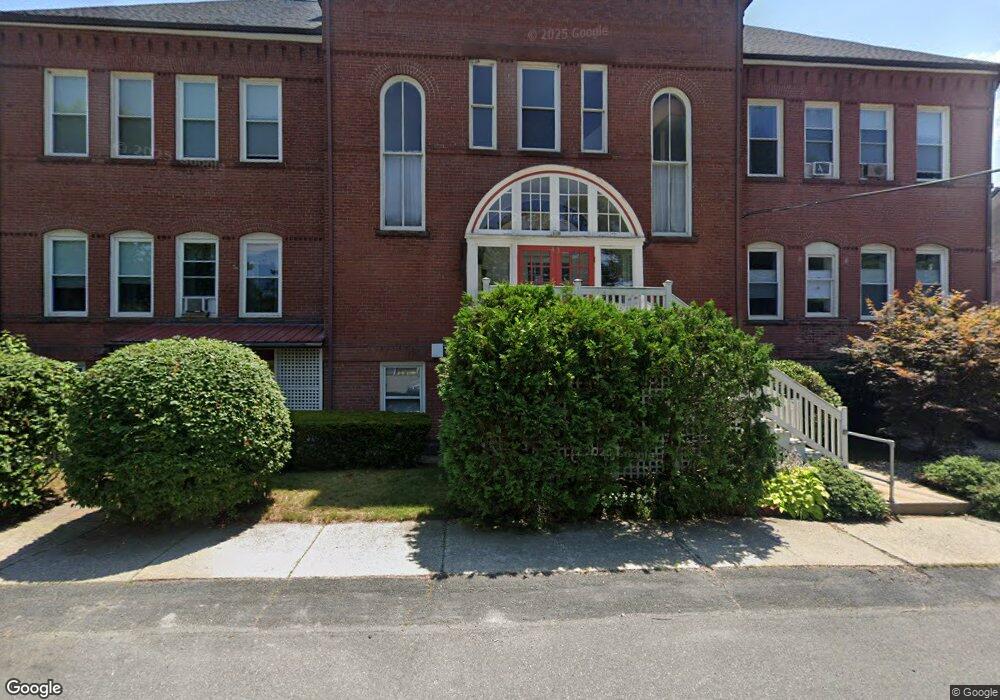
43 J St Unit H Turners Falls, MA 01376
Estimated Value: $137,000 - $187,918
1
Bed
1
Bath
671
Sq Ft
$248/Sq Ft
Est. Value
About This Home
This home is located at 43 J St Unit H, Turners Falls, MA 01376 and is currently estimated at $166,230, approximately $247 per square foot. 43 J St Unit H is a home located in Franklin County with nearby schools including Holy Trinity School and Four Winds School.
Ownership History
Date
Name
Owned For
Owner Type
Purchase Details
Closed on
Sep 20, 2025
Sold by
Marcel James View T and Viens
Bought by
Nied Robert and Nied Owen
Current Estimated Value
Purchase Details
Closed on
Feb 29, 2016
Sold by
Citimortgage Inc
Bought by
Marcel James Viens T and Marcel Viens
Purchase Details
Closed on
May 30, 2003
Sold by
Macleod Susan E
Bought by
Mccarthy Timothy D
Home Financials for this Owner
Home Financials are based on the most recent Mortgage that was taken out on this home.
Original Mortgage
$45,000
Interest Rate
5.86%
Mortgage Type
Purchase Money Mortgage
Create a Home Valuation Report for This Property
The Home Valuation Report is an in-depth analysis detailing your home's value as well as a comparison with similar homes in the area
Home Values in the Area
Average Home Value in this Area
Purchase History
| Date | Buyer | Sale Price | Title Company |
|---|---|---|---|
| Nied Robert | $181,000 | -- | |
| Marcel James Viens T | $65,000 | -- | |
| Marcel James Viens T | $65,000 | -- | |
| Mccarthy Timothy D | $45,000 | -- | |
| Mccarthy Timothy D | $45,000 | -- |
Source: Public Records
Mortgage History
| Date | Status | Borrower | Loan Amount |
|---|---|---|---|
| Previous Owner | Mccarthy Timothy D | $45,000 |
Source: Public Records
Tax History Compared to Growth
Tax History
| Year | Tax Paid | Tax Assessment Tax Assessment Total Assessment is a certain percentage of the fair market value that is determined by local assessors to be the total taxable value of land and additions on the property. | Land | Improvement |
|---|---|---|---|---|
| 2025 | $2,215 | $145,600 | $0 | $145,600 |
| 2024 | $1,942 | $123,700 | $0 | $123,700 |
| 2023 | $1,936 | $123,700 | $0 | $123,700 |
| 2022 | $1,730 | $103,200 | $0 | $103,200 |
| 2021 | $1,800 | $103,200 | $0 | $103,200 |
| 2020 | $1,638 | $93,200 | $0 | $93,200 |
| 2019 | $1,262 | $73,700 | $0 | $73,700 |
| 2018 | $1,290 | $75,500 | $0 | $75,500 |
| 2017 | $1,259 | $75,500 | $0 | $75,500 |
| 2016 | $1,185 | $67,300 | $0 | $67,300 |
| 2015 | $1,141 | $67,300 | $0 | $67,300 |
| 2014 | $1,100 | $67,300 | $0 | $67,300 |
Source: Public Records
Map
Nearby Homes
- 30 Park St
- 21 Hillside Ave
- 0 Millers Falls Rd Unit 73034825
- 45 Millers Falls Rd
- 79 Burnham Rd
- 89 Montague St
- 696 Bernardston Rd
- 2 Alice St
- 114 Montague St
- 001 Adams Rd
- 202 Turnpike Rd
- 72 Meadowood Dr
- 31 Lovers Ln
- 183 Millers Falls Rd
- 335 Federal St
- 35-37 Shattuck St
- 35 Shattuck St Unit 37
- 69 Madison Cir
- 93 Maple St
- 38 Randall Wood Dr