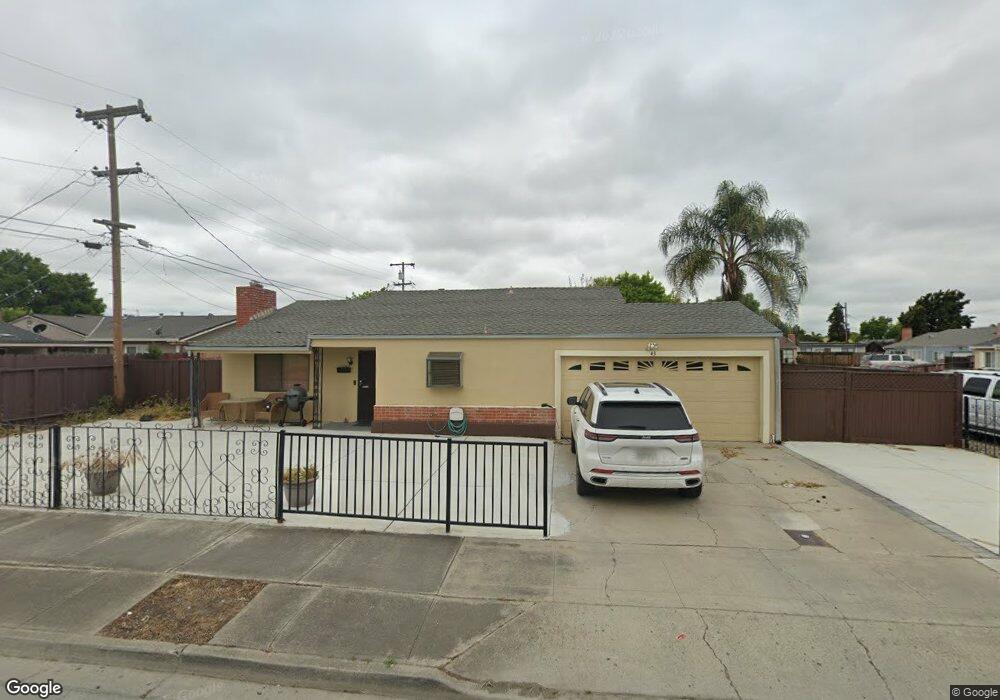
43 N Chappell Rd Hollister, CA 95023
Estimated Value: $593,000 - $726,000
--
Bed
--
Bath
--
Sq Ft
5,053
Sq Ft Lot
About This Home
This home is located at 43 N Chappell Rd, Hollister, CA 95023 and is currently estimated at $658,683. 43 N Chappell Rd is a home located in San Benito County with nearby schools including Gabilan Hills School, Maze Middle School, and San Benito High School.
Ownership History
Date
Name
Owned For
Owner Type
Purchase Details
Closed on
Aug 24, 2021
Sold by
Ferry Adriana
Bought by
Ferry Devon and Ferry Adriana
Current Estimated Value
Home Financials for this Owner
Home Financials are based on the most recent Mortgage that was taken out on this home.
Original Mortgage
$211,000
Outstanding Balance
$191,575
Interest Rate
2.8%
Mortgage Type
New Conventional
Estimated Equity
$467,108
Purchase Details
Closed on
May 18, 2021
Sold by
Ferry Adriana and H & I Acosta Family Trust
Bought by
Ferry Adriana
Purchase Details
Closed on
Aug 15, 2018
Sold by
Acosta Hector and Acosta Irma S
Bought by
Acosta Hector and Acosta Irma S
Purchase Details
Closed on
Apr 17, 2002
Sold by
Acosta Hector and Acosta Irma
Bought by
Acosta Hector and Acosta Irma
Home Financials for this Owner
Home Financials are based on the most recent Mortgage that was taken out on this home.
Original Mortgage
$65,000
Interest Rate
7.08%
Create a Home Valuation Report for This Property
The Home Valuation Report is an in-depth analysis detailing your home's value as well as a comparison with similar homes in the area
Home Values in the Area
Average Home Value in this Area
Purchase History
| Date | Buyer | Sale Price | Title Company |
|---|---|---|---|
| Ferry Devon | -- | Chicago Title Company | |
| Ferry Adriana | -- | None Available | |
| Acosta Hector | -- | None Available | |
| Acosta Hector | -- | None Available | |
| Acosta Hector | -- | -- | |
| Acosta Hector | -- | -- |
Source: Public Records
Mortgage History
| Date | Status | Borrower | Loan Amount |
|---|---|---|---|
| Open | Ferry Devon | $211,000 | |
| Previous Owner | Acosta Hector | $65,000 |
Source: Public Records
Tax History Compared to Growth
Tax History
| Year | Tax Paid | Tax Assessment Tax Assessment Total Assessment is a certain percentage of the fair market value that is determined by local assessors to be the total taxable value of land and additions on the property. | Land | Improvement |
|---|---|---|---|---|
| 2025 | $6,860 | $562,863 | $238,134 | $324,729 |
| 2023 | $6,860 | $541,008 | $228,888 | $312,120 |
| 2022 | $816 | $66,286 | $11,722 | $54,564 |
| 2021 | $708 | $64,988 | $11,493 | $53,495 |
| 2020 | $711 | $64,323 | $11,376 | $52,947 |
| 2019 | $689 | $63,062 | $11,153 | $51,909 |
| 2018 | $688 | $61,827 | $10,935 | $50,892 |
| 2017 | $678 | $60,616 | $10,721 | $49,895 |
| 2016 | $632 | $59,428 | $10,511 | $48,917 |
| 2015 | $625 | $58,537 | $10,354 | $48,183 |
| 2014 | $586 | $57,392 | $10,152 | $47,240 |
Source: Public Records
Map
Nearby Homes
- Plan 2288 at Everglen
- Plan 2862 at Everglen
- Plan 1434 Modeled at Everglen
- Plan 1910 Modeled at Everglen
- Plan 2069 at Everglen
- 331 Summer Morning Dr
- 321 Summer Morning Dr
- 401 Walk About Way
- 0 Hwy 25 Unit 21712114
- 190 San Benito St
- 441 Adrian Ct
- 220 4th St
- 751 La Baig Dr
- 202 5th St
- 435 San Benito St
- 400 San Benito St Unit 309
- 400 San Benito St Unit 308
- 400 San Benito St Unit 202
- 400 San Benito St Unit 304
- 400 San Benito St Unit 212
- 42 Chappell Cir
- 260 San Juan Dr
- 36 N Chappell Rd
- 41 Chappell Cir
- 250 San Juan Dr
- 37 Chappell Cir
- 240 San Juan Dr
- 38 Chappell Cir
- 40 Chappell Cir
- 271 Maple St
- 267 Maple St
- 39 Chappell Cir
- 271 San Juan Dr
- 267 San Juan Dr
- 263 San Juan Dr
- 220 San Juan Dr
- 259 San Juan Dr
- 208 San Juan Dr
- 206 San Juan Dr
- 255 Maple St