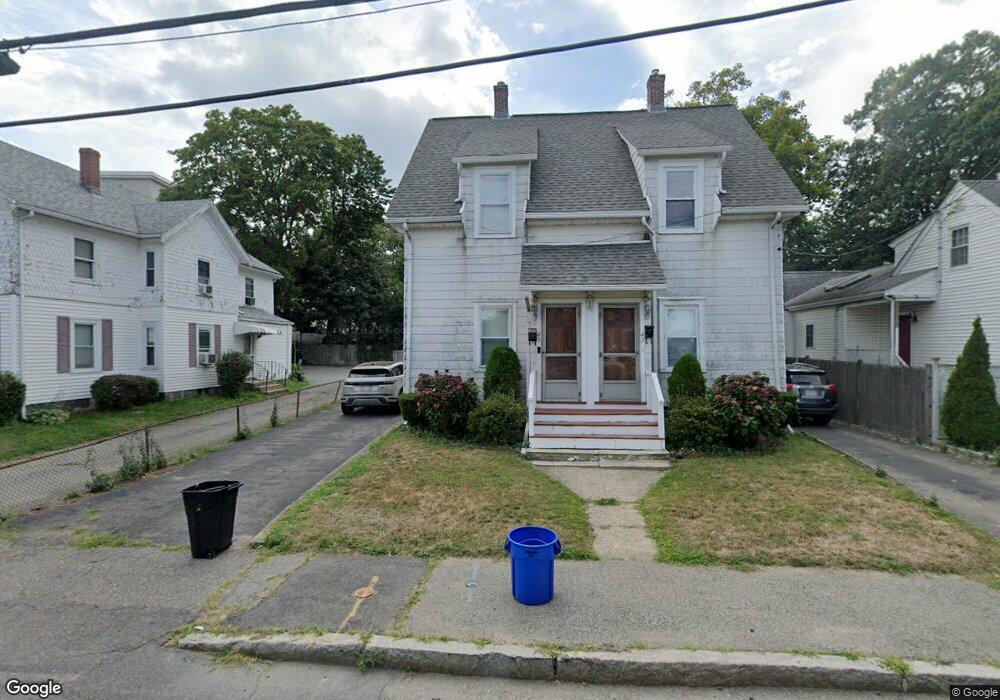
43 Newcomb St Quincy, MA 02169
Quincy Center NeighborhoodEstimated Value: $686,000 - $1,012,000
About This Home
$2,350 / 2br - 1000ft2 - Convenient 2 br house for rent, walk to T & YMCA across the street
Well maintained 2 bedroom/1 bath house for rent. Walk to Quincy Center T, Stop & Shop, restaurants, easy access to highway 93 and close to Wollaston Beach. Hardwood floor throughout.
First level - kitchen with dishwasher, dining room and living room. Second level - two bedrooms, full bath and additional office space. This two level unit comes with extra storage in the basement, two driveway parking spaces, and Lennox central A/C.
No Pets are allowed. First, last, and security at signing. Subject to credit check and good references. Tenant must have good credit history. EMAIL ONLY!!! PLEASE INCLUDE THE LINK OF THIS LISTING IN THE EMAIL AND GIVE A BRIEF DESCRIPTION OF YOUR BACKGROUND!!! CREDIT MUST BE GOOD STANDING TO QUALIFY. Rent includes : Cold Water, Sewage Disposal, Parking
Ownership History
Purchase Details
Purchase Details
Home Financials for this Owner
Home Financials are based on the most recent Mortgage that was taken out on this home.Home Values in the Area
Average Home Value in this Area
Purchase History
| Date | Buyer | Sale Price | Title Company |
|---|---|---|---|
| Wong Jeffrey | -- | -- | |
| Huang Xin R | $208,000 | -- |
Mortgage History
| Date | Status | Borrower | Loan Amount |
|---|---|---|---|
| Previous Owner | Huang Xin R | $138,000 | |
| Previous Owner | Huang Xin R | $50,000 | |
| Previous Owner | Huang Xin R | $56,434 |
Property History
| Date | Event | Price | List to Sale | Price per Sq Ft |
|---|---|---|---|---|
| 09/22/2025 09/22/25 | Off Market | $2,350 | -- | -- |
| 09/07/2025 09/07/25 | For Rent | $2,350 | 0.0% | -- |
| 07/14/2025 07/14/25 | Off Market | $2,350 | -- | -- |
| 06/19/2025 06/19/25 | For Rent | $2,350 | -- | -- |
Tax History Compared to Growth
Tax History
| Year | Tax Paid | Tax Assessment Tax Assessment Total Assessment is a certain percentage of the fair market value that is determined by local assessors to be the total taxable value of land and additions on the property. | Land | Improvement |
|---|---|---|---|---|
| 2025 | $8,584 | $744,500 | $275,200 | $469,300 |
| 2024 | $8,093 | $718,100 | $262,100 | $456,000 |
| 2023 | $7,728 | $694,300 | $238,300 | $456,000 |
| 2022 | $7,815 | $652,300 | $216,600 | $435,700 |
| 2021 | $7,371 | $607,200 | $216,600 | $390,600 |
| 2020 | $7,326 | $589,400 | $206,300 | $383,100 |
| 2019 | $5,954 | $474,400 | $194,600 | $279,800 |
| 2018 | $6,116 | $458,500 | $194,600 | $263,900 |
| 2017 | $6,300 | $444,600 | $185,400 | $259,200 |
| 2016 | $5,790 | $403,200 | $176,500 | $226,700 |
| 2015 | $5,706 | $390,800 | $176,500 | $214,300 |
| 2014 | $4,914 | $330,700 | $168,100 | $162,600 |
Map
- 66 Mcgrath Hwy Unit 407
- 66 Mcgrath Hwy Unit 405
- 66 Mcgrath Hwy Unit 308
- 66 Mcgrath Hwy Unit 303
- 66 Mcgrath Hwy Unit 508
- 59 Spear St Unit 302
- 59 Spear St Unit 301
- 59 Spear St Unit 202
- 106 Washington St Unit 45
- 187 Washington St
- 35 Miller Stile Rd
- 2 Cliveden St Unit 601E
- 2 Cliveden St Unit 405E
- 20 Whitney Rd Unit 1
- 18 Cliveden St Unit 406W
- 18 Cliveden St Unit 201W
- 33 Elm St
- 313 Washington St
- 1 Adams St Unit 707
- 105 Sea St Unit 301
- 49 Newcomb St
- 49 Newcomb St Unit 2
- 51 Newcomb St
- 49 Newcomb St Unit 1
- 39 Newcomb St Unit 2
- 39 Newcomb St Unit 1
- 35 Newcomb St
- 39 Newcomb St
- 35 Newcomb St Unit 1
- 999 Newcomb St
- 53 Newcomb St
- 52 Newcomb St
- 52 Newcomb St Unit 2
- 48 Newcomb St
- 48 Newcomb St Unit 48
- 21 Granville St
- 17 Granville St
- 17 Granville St Unit 1
- 17 Granville St Unit 2
- 70 Spear St