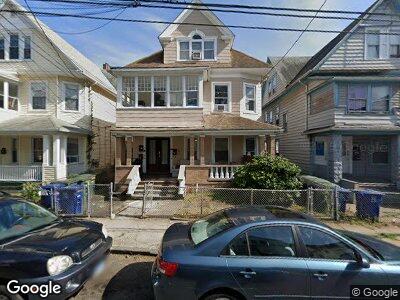
43 Park Terrace Bridgeport, CT 06604
South End NeighborhoodEstimated Value: $270,418 - $566,000
3
Beds
1
Bath
1,200
Sq Ft
$328/Sq Ft
Est. Value
About This Home
This home is located at 43 Park Terrace, Bridgeport, CT 06604 and is currently estimated at $393,105, approximately $327 per square foot. 43 Park Terrace is a home located in Fairfield County with nearby schools including Roosevelt School, Bassick High School, and New Beginnings Family Academy.
Ownership History
Date
Name
Owned For
Owner Type
Purchase Details
Closed on
Nov 24, 2020
Sold by
Yasutake Paul
Bought by
Yashtake Christoph and Yasutake Paul
Current Estimated Value
Purchase Details
Closed on
Oct 28, 2003
Sold by
Rivera Mayna
Bought by
Yasutake Paul
Home Financials for this Owner
Home Financials are based on the most recent Mortgage that was taken out on this home.
Original Mortgage
$112,000
Interest Rate
6.15%
Purchase Details
Closed on
Apr 21, 1995
Sold by
Dime Sb Ny
Bought by
Rivera Mayra
Home Financials for this Owner
Home Financials are based on the most recent Mortgage that was taken out on this home.
Original Mortgage
$25,200
Interest Rate
8.55%
Mortgage Type
Unknown
Purchase Details
Closed on
May 28, 1987
Sold by
Russell Donna
Bought by
Delgado Cruz
Purchase Details
Closed on
Feb 2, 1987
Sold by
North America B & T
Bought by
Russell Donna
Create a Home Valuation Report for This Property
The Home Valuation Report is an in-depth analysis detailing your home's value as well as a comparison with similar homes in the area
Home Values in the Area
Average Home Value in this Area
Purchase History
| Date | Buyer | Sale Price | Title Company |
|---|---|---|---|
| Yashtake Christoph | -- | None Available | |
| Yasutake Paul | $160,000 | -- | |
| Yasutake Paul | $160,000 | -- | |
| Rivera Mayra | $36,000 | -- | |
| Rivera Mayra | $36,000 | -- | |
| Delgado Cruz | $120,000 | -- | |
| Russell Donna | $49,000 | -- |
Source: Public Records
Mortgage History
| Date | Status | Borrower | Loan Amount |
|---|---|---|---|
| Previous Owner | Russell Donna | $112,000 | |
| Previous Owner | Russell Donna | $25,200 |
Source: Public Records
Tax History Compared to Growth
Tax History
| Year | Tax Paid | Tax Assessment Tax Assessment Total Assessment is a certain percentage of the fair market value that is determined by local assessors to be the total taxable value of land and additions on the property. | Land | Improvement |
|---|---|---|---|---|
| 2024 | $4,631 | $106,580 | $29,450 | $77,130 |
| 2023 | $4,631 | $106,580 | $29,450 | $77,130 |
| 2022 | $4,631 | $106,580 | $29,450 | $77,130 |
| 2021 | $4,631 | $106,580 | $29,450 | $77,130 |
| 2020 | $6,859 | $127,050 | $28,690 | $98,360 |
| 2019 | $6,859 | $127,050 | $28,690 | $98,360 |
| 2018 | $6,908 | $127,050 | $28,690 | $98,360 |
| 2017 | $6,908 | $127,050 | $28,690 | $98,360 |
| 2016 | $6,908 | $127,050 | $28,690 | $98,360 |
| 2015 | $7,701 | $182,480 | $40,520 | $141,960 |
| 2014 | $7,701 | $182,480 | $40,520 | $141,960 |
Source: Public Records
Map
Nearby Homes
- 120 Park Terrace
- 373 Iranistan Ave
- 419 Iranistan Ave
- 22 Sims St
- 30 Cole St
- 325 Lafayette St Unit 4301
- 325 Lafayette St Unit 1302
- 325 Lafayette St Unit 8208
- 35 Sims St
- 72 Sims St
- 122 Sims St
- 128 Alsace St
- 831 Park Ave
- 185 Cottage St
- 10-12 Cottage Place
- 757 Iranistan Ave Unit 759
- 818 Iranistan Ave Unit 822
- 211 Norman St
- 53-55 Fremont St
- 24 Fremont St
- 43 Park Terrace
- 37 Park Terrace
- 51 Park Terrace
- 53 Park Terrace
- 57 Park Terrace Unit 59
- 29 Park Terrace
- 362 Gregory St Unit 364
- 372 Gregory St
- 65 Park Terrace Unit 67
- 354 Gregory St Unit 356
- 382 Gregory St Unit 388
- 48 Park Terrace
- 48 Park Terrace Unit 1st floor
- 48 Park Terrace Unit 2nd floor
- 39 Park Terrace
- 50 Park Terrace
- 40 Park Terrace
- 26 Park Terrace
- 56 Park Terrace
- 56 Park Terrace Unit 2nd Floor