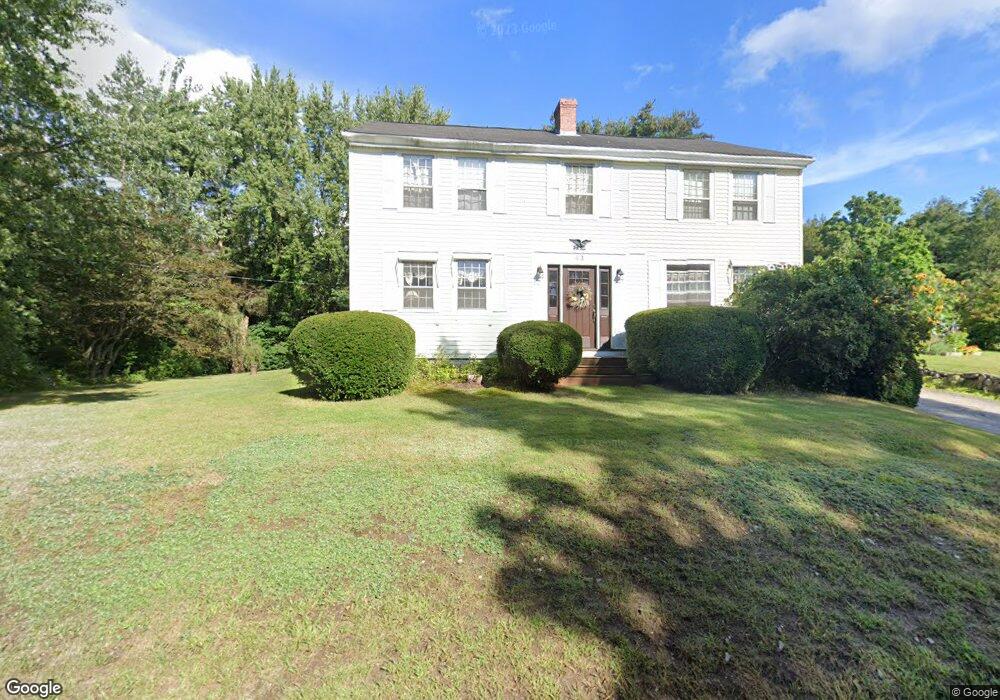
43 Pleasant St Hooksett, NH 03106
Estimated Value: $569,141 - $667,000
3
Beds
1
Bath
2,602
Sq Ft
$234/Sq Ft
Est. Value
About This Home
This home is located at 43 Pleasant St, Hooksett, NH 03106 and is currently estimated at $608,035, approximately $233 per square foot. 43 Pleasant St is a home located in Merrimack County with nearby schools including Fred C. Underhill School, Hooksett Memorial School, and David R. Cawley Middle School.
Ownership History
Date
Name
Owned For
Owner Type
Purchase Details
Closed on
Jan 3, 2005
Sold by
Bourgoin 2Nd Ronald P and Bourgoin Sherri A
Bought by
Runnion-Barefo Benjamin S
Current Estimated Value
Home Financials for this Owner
Home Financials are based on the most recent Mortgage that was taken out on this home.
Original Mortgage
$196,000
Outstanding Balance
$33,089
Interest Rate
6%
Estimated Equity
$574,946
Purchase Details
Closed on
Jun 24, 2002
Sold by
Relocation Resources I
Bought by
Bourgoin Ii Ronald P and Bourgoin Sherri A
Home Financials for this Owner
Home Financials are based on the most recent Mortgage that was taken out on this home.
Original Mortgage
$115,000
Interest Rate
6.81%
Purchase Details
Closed on
Apr 17, 2000
Sold by
Lidbeck Est Florence H
Bought by
Semian James and Semian Jessica
Home Financials for this Owner
Home Financials are based on the most recent Mortgage that was taken out on this home.
Original Mortgage
$124,200
Interest Rate
8.26%
Create a Home Valuation Report for This Property
The Home Valuation Report is an in-depth analysis detailing your home's value as well as a comparison with similar homes in the area
Home Values in the Area
Average Home Value in this Area
Purchase History
| Date | Buyer | Sale Price | Title Company |
|---|---|---|---|
| Runnion-Barefo Benjamin S | $245,000 | -- | |
| Runnion-Bareford B S | $245,000 | -- | |
| Bourgoin Ii Ronald P | $210,000 | -- | |
| Semian James | $138,000 | -- |
Source: Public Records
Mortgage History
| Date | Status | Borrower | Loan Amount |
|---|---|---|---|
| Open | Semian James | $63,700 | |
| Open | Runnion-Bareford B S | $196,000 | |
| Closed | Semian James | $196,000 | |
| Previous Owner | Semian James | $115,000 | |
| Previous Owner | Semian James | $124,200 |
Source: Public Records
Tax History Compared to Growth
Tax History
| Year | Tax Paid | Tax Assessment Tax Assessment Total Assessment is a certain percentage of the fair market value that is determined by local assessors to be the total taxable value of land and additions on the property. | Land | Improvement |
|---|---|---|---|---|
| 2024 | $8,297 | $489,200 | $139,900 | $349,300 |
| 2023 | $7,817 | $489,200 | $139,900 | $349,300 |
| 2022 | $6,494 | $270,000 | $88,400 | $181,600 |
| 2021 | $5,999 | $270,000 | $88,400 | $181,600 |
| 2020 | $6,929 | $270,000 | $88,400 | $181,600 |
| 2019 | $6,467 | $270,000 | $88,400 | $181,600 |
| 2018 | $6,392 | $270,000 | $88,400 | $181,600 |
| 2017 | $6,117 | $237,500 | $79,500 | $158,000 |
| 2016 | $6,268 | $237,500 | $79,500 | $158,000 |
| 2015 | $5,871 | $237,500 | $79,500 | $158,000 |
| 2014 | $5,897 | $237,500 | $79,500 | $158,000 |
| 2013 | $5,577 | $237,500 | $79,500 | $158,000 |
Source: Public Records
Map
Nearby Homes
- 15 Main St
- 1821 Hooksett Rd
- 422 Dawn Dr Unit 23
- 427 Dawn Dr Unit 15
- 4 Rodger Rd
- 7 Ferry St
- 19 Sullivan Dr
- 2 Cheryl Dr
- 10 Lane Dr
- 111 Glass St
- 100 Main St Unit M10
- 100 Main St Unit 204
- 1 1/2 Bartlett St
- 12-14 Church St Unit 12,14
- 15 Sullivan Dr
- 14 Manor Dr Unit D
- 12 Manor Dr Unit B
- 62 Pine St
- 12 Crawford Ln
- 233 Pembroke St
- 42 Pleasant St
- 40 Pleasant St
- 41 Pleasant St
- 45 Pleasant St
- 38 Pleasant St
- 39 Pleasant St
- 44 Pleasant St
- 160 Merrimack St
- 49 Pleasant St
- 36 Pleasant St
- 159 Merrimack St
- 158 Merrimack St
- 37 Pleasant St
- 51 Pleasant St
- 157 Merrimack St
- 53 Pleasant St
- 155 Merrimack St
- 156 Merrimack St
- 32 Pleasant St
- 33 Pleasant St