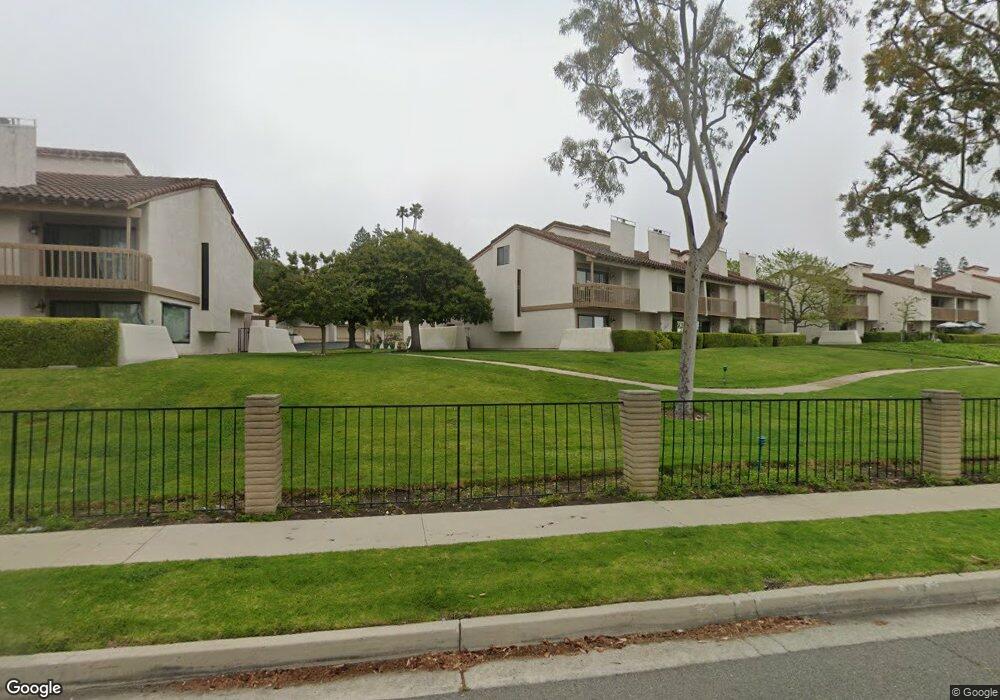
43 Seaview Dr N Rolling Hills Estates, CA 90274
Estimated Value: $1,181,000 - $1,540,000
3
Beds
3
Baths
1,858
Sq Ft
$709/Sq Ft
Est. Value
About This Home
This home is located at 43 Seaview Dr N, Rolling Hills Estates, CA 90274 and is currently estimated at $1,317,383, approximately $709 per square foot. 43 Seaview Dr N is a home located in Los Angeles County with nearby schools including Soleado Elementary, Ridgecrest Intermediate, and Palos Verdes Peninsula High School.
Ownership History
Date
Name
Owned For
Owner Type
Purchase Details
Closed on
Nov 1, 2001
Sold by
Monheiser Maritza Soria
Bought by
Monheiser Paul A
Current Estimated Value
Home Financials for this Owner
Home Financials are based on the most recent Mortgage that was taken out on this home.
Original Mortgage
$328,000
Outstanding Balance
$125,856
Interest Rate
6.62%
Mortgage Type
Purchase Money Mortgage
Estimated Equity
$1,191,527
Purchase Details
Closed on
Oct 22, 2001
Sold by
Rea Edmund J
Bought by
Monheiser Paul A
Home Financials for this Owner
Home Financials are based on the most recent Mortgage that was taken out on this home.
Original Mortgage
$328,000
Outstanding Balance
$125,856
Interest Rate
6.62%
Mortgage Type
Purchase Money Mortgage
Estimated Equity
$1,191,527
Create a Home Valuation Report for This Property
The Home Valuation Report is an in-depth analysis detailing your home's value as well as a comparison with similar homes in the area
Home Values in the Area
Average Home Value in this Area
Purchase History
| Date | Buyer | Sale Price | Title Company |
|---|---|---|---|
| Monheiser Paul A | -- | California Title Company | |
| Monheiser Paul A | $410,000 | California Title Company |
Source: Public Records
Mortgage History
| Date | Status | Borrower | Loan Amount |
|---|---|---|---|
| Open | Monheiser Paul A | $328,000 | |
| Closed | Monheiser Paul A | $82,000 |
Source: Public Records
Tax History Compared to Growth
Tax History
| Year | Tax Paid | Tax Assessment Tax Assessment Total Assessment is a certain percentage of the fair market value that is determined by local assessors to be the total taxable value of land and additions on the property. | Land | Improvement |
|---|---|---|---|---|
| 2025 | $7,357 | $605,674 | $344,348 | $261,326 |
| 2024 | $7,357 | $593,799 | $337,597 | $256,202 |
| 2023 | $7,251 | $582,157 | $330,978 | $251,179 |
| 2022 | $6,895 | $570,743 | $324,489 | $246,254 |
| 2021 | $6,849 | $559,553 | $318,127 | $241,426 |
| 2020 | $6,751 | $553,816 | $314,865 | $238,951 |
| 2019 | $6,554 | $542,958 | $308,692 | $234,266 |
| 2018 | $6,490 | $532,313 | $302,640 | $229,673 |
| 2016 | $9,274 | $511,644 | $290,889 | $220,755 |
| 2015 | $9,219 | $503,960 | $286,520 | $217,440 |
| 2014 | $6,000 | $494,089 | $280,908 | $213,181 |
Source: Public Records
Map
Nearby Homes
- 22 Seaview Dr S
- 23 Country Meadow Rd
- 5726 Sunmist Dr
- 23 Quarterhorse Ln
- 5567 Mistridge Dr
- 29 Santa Barbara Dr
- 21 Santa Catalina Dr
- 31 Aspen Way
- 48 Santa Cruz
- 48 Via Porto Grande
- 37 Santa Cruz
- 54 Cresta Verde Dr
- 105 Aspen Way
- 71 Cresta Verde Dr
- 84 Cresta Verde Dr
- 1 Crestwind Dr
- 45 Oaktree Ln
- 29600 Island View Dr Unit 201
- 627 Deep Valley Dr Unit 211
- 627 Deep Valley Dr Unit P612
- 41 Seaview Dr N
- 39 Seaview Dr N
- 37 Seaview Dr N
- 45 Seaview Dr N
- 47 Seaview Dr N
- 49 Seaview Dr N
- 35 Seaview Dr N
- 35 Seaview Dr S
- 33 Seaview Dr N
- 42 Seaview Dr N
- 40 Seaview Dr N
- 31 Seaview Dr S
- 38 Seaview Dr N
- 36 Seaview Dr N
- 31 Seaview Dr N
- 34 Seaview Dr N
- 32 Seaview Dr N
- 29 Seaview Dr N
- 29327 Stonecrest Rd
- 30 Seaview Dr N