Estimated Value: $89,000 - $162,000
--
Bed
--
Bath
1,600
Sq Ft
$78/Sq Ft
Est. Value
About This Home
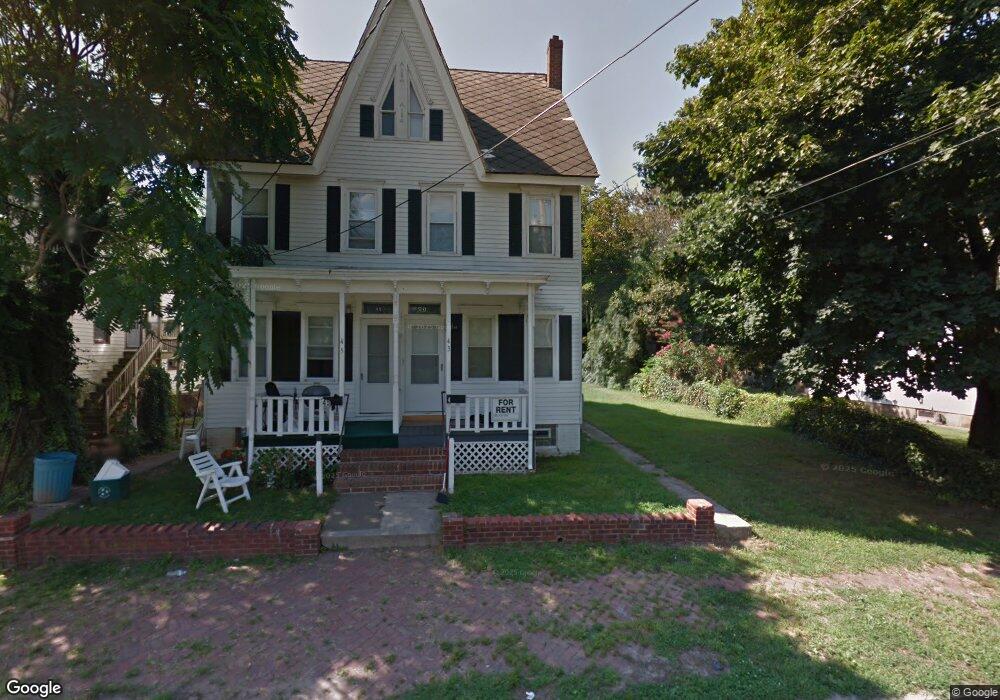
This home is located at 43 Seventh St, Salem, NJ 08079 and is currently estimated at $124,951, approximately $78 per square foot. 43 Seventh St is a home located in Salem County with nearby schools including John Fenwick Elementary School, Salem Middle School, and Salem High School.
Ownership History
Date
Name
Owned For
Owner Type
Purchase Details
Closed on
Dec 15, 2022
Sold by
J L Assets Limited Liability Company
Bought by
Citron Ventures Llc
Current Estimated Value
Home Financials for this Owner
Home Financials are based on the most recent Mortgage that was taken out on this home.
Original Mortgage
$25,000
Interest Rate
6.95%
Mortgage Type
New Conventional
Purchase Details
Closed on
Feb 2, 2018
Sold by
Jl Assets Llc
Bought by
Battjer Laura C
Purchase Details
Closed on
Oct 19, 2006
Sold by
Battjer Laura C
Bought by
J L Assets Llc
Home Financials for this Owner
Home Financials are based on the most recent Mortgage that was taken out on this home.
Original Mortgage
$44,000
Interest Rate
6.49%
Mortgage Type
New Conventional
Create a Home Valuation Report for This Property
The Home Valuation Report is an in-depth analysis detailing your home's value as well as a comparison with similar homes in the area
Home Values in the Area
Average Home Value in this Area
Purchase History
| Date | Buyer | Sale Price | Title Company |
|---|---|---|---|
| Citron Ventures Llc | $55,000 | -- | |
| Citron Ventures Llc | $55,000 | None Listed On Document | |
| Battjer Laura C | $37,527 | -- | |
| J L Assets Llc | -- | Salem Oak Title Agency Inc | |
| Battjer Laura C | $55,000 | Salem Oak Title Agency Inc |
Source: Public Records
Mortgage History
| Date | Status | Borrower | Loan Amount |
|---|---|---|---|
| Closed | Citron Ventures Llc | $25,000 | |
| Previous Owner | Battjer Laura C | $44,000 |
Source: Public Records
Tax History Compared to Growth
Tax History
| Year | Tax Paid | Tax Assessment Tax Assessment Total Assessment is a certain percentage of the fair market value that is determined by local assessors to be the total taxable value of land and additions on the property. | Land | Improvement |
|---|---|---|---|---|
| 2025 | $2,993 | $36,400 | $8,900 | $27,500 |
| 2024 | $2,861 | $36,400 | $8,900 | $27,500 |
| 2023 | $2,861 | $36,400 | $8,900 | $27,500 |
| 2022 | $2,736 | $36,400 | $8,900 | $27,500 |
| 2021 | $2,642 | $36,400 | $8,900 | $27,500 |
| 2020 | $2,589 | $36,400 | $8,900 | $27,500 |
| 2019 | $2,573 | $36,400 | $8,900 | $27,500 |
| 2018 | $2,517 | $36,400 | $8,900 | $27,500 |
| 2017 | $2,486 | $36,400 | $8,900 | $27,500 |
| 2016 | $2,886 | $73,700 | $14,500 | $59,200 |
| 2015 | $2,849 | $73,700 | $14,500 | $59,200 |
| 2014 | $2,835 | $73,700 | $14,500 | $59,200 |
Source: Public Records
Map
Nearby Homes