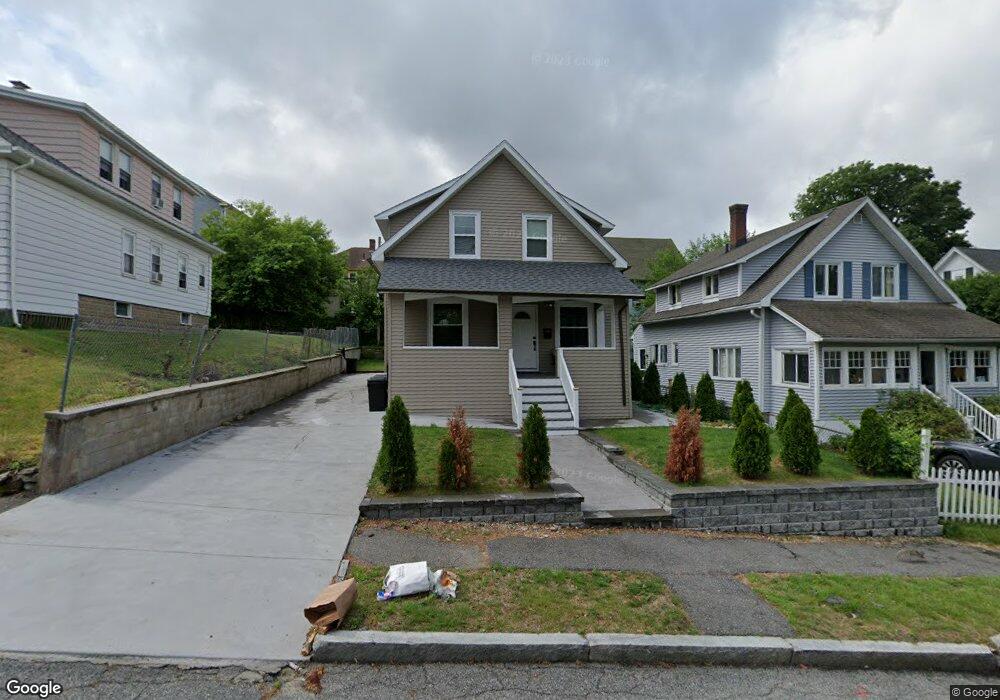
43 Sherburne Ave Worcester, MA 01606
Indian Lake East NeighborhoodEstimated Value: $413,000 - $463,000
3
Beds
3
Baths
1,250
Sq Ft
$349/Sq Ft
Est. Value
About This Home
This home is located at 43 Sherburne Ave, Worcester, MA 01606 and is currently estimated at $435,947, approximately $348 per square foot. 43 Sherburne Ave is a home located in Worcester County with nearby schools including Francis J. McGrath Elementary School, Jacob Hiatt Magnet School, and Chandler Magnet.
Ownership History
Date
Name
Owned For
Owner Type
Purchase Details
Closed on
May 8, 2009
Sold by
Department Of Housing & Urban Dev
Bought by
Akande Biodun G
Current Estimated Value
Home Financials for this Owner
Home Financials are based on the most recent Mortgage that was taken out on this home.
Original Mortgage
$72,000
Outstanding Balance
$45,614
Interest Rate
4.9%
Mortgage Type
Purchase Money Mortgage
Estimated Equity
$390,333
Purchase Details
Closed on
Jan 7, 2008
Sold by
Citimortgage Inc
Bought by
Department Of Housing & Urban Dev
Purchase Details
Closed on
Dec 30, 2004
Sold by
Peters Frank B and Peters Violet M
Bought by
Durbaku Diana and Durbaku Nevrus
Home Financials for this Owner
Home Financials are based on the most recent Mortgage that was taken out on this home.
Original Mortgage
$189,200
Interest Rate
5.73%
Mortgage Type
Purchase Money Mortgage
Create a Home Valuation Report for This Property
The Home Valuation Report is an in-depth analysis detailing your home's value as well as a comparison with similar homes in the area
Home Values in the Area
Average Home Value in this Area
Purchase History
| Date | Buyer | Sale Price | Title Company |
|---|---|---|---|
| Akande Biodun G | $90,000 | -- | |
| Department Of Housing & Urban Dev | -- | -- | |
| Citimortgage Inc | $267,723 | -- | |
| Durbaku Diana | $189,200 | -- |
Source: Public Records
Mortgage History
| Date | Status | Borrower | Loan Amount |
|---|---|---|---|
| Open | Akande Biodun G | $72,000 | |
| Previous Owner | Durbaku Diana | $189,200 |
Source: Public Records
Tax History
| Year | Tax Paid | Tax Assessment Tax Assessment Total Assessment is a certain percentage of the fair market value that is determined by local assessors to be the total taxable value of land and additions on the property. | Land | Improvement |
|---|---|---|---|---|
| 2025 | $5,199 | $394,200 | $81,900 | $312,300 |
| 2024 | $5,059 | $367,900 | $81,900 | $286,000 |
| 2023 | $4,232 | $295,100 | $71,200 | $223,900 |
| 2022 | $3,907 | $256,900 | $57,000 | $199,900 |
| 2021 | $3,277 | $201,300 | $45,600 | $155,700 |
| 2020 | $3,108 | $182,800 | $45,600 | $137,200 |
| 2019 | $2,983 | $165,700 | $41,000 | $124,700 |
| 2018 | $2,967 | $156,900 | $41,000 | $115,900 |
| 2017 | $2,831 | $147,300 | $41,000 | $106,300 |
| 2016 | $2,852 | $138,400 | $31,200 | $107,200 |
| 2015 | $2,778 | $138,400 | $31,200 | $107,200 |
| 2014 | $2,704 | $138,400 | $31,200 | $107,200 |
Source: Public Records
Map
Nearby Homes
- 45 Sherburne Ave
- 41 Sherburne Ave
- 54 Scrimgeour Rd
- 37 Sherburne Ave
- 37 Sherburne Ave Unit 1
- 37 Sherburne Ave Unit 3
- 62 Proctor St
- 49 Sherburne Ave
- 50 Scrimgeour Rd
- 48 Sherburne Ave
- 33 Sherburne Ave
- 26 Sherburne Ave
- 50 Sherburne Ave
- 44 Scrimgeour Rd
- 27 Sherburne Ave
- 59 Scrimgeour Rd
- 57 Proctor St
- 105 Boyd St
- 15 Clason Rd
- 24 Sherburne Ave
Your Personal Tour Guide
Ask me questions while you tour the home.