Estimated Value: $456,000 - $526,161
3
Beds
2
Baths
1,230
Sq Ft
$407/Sq Ft
Est. Value
About This Home
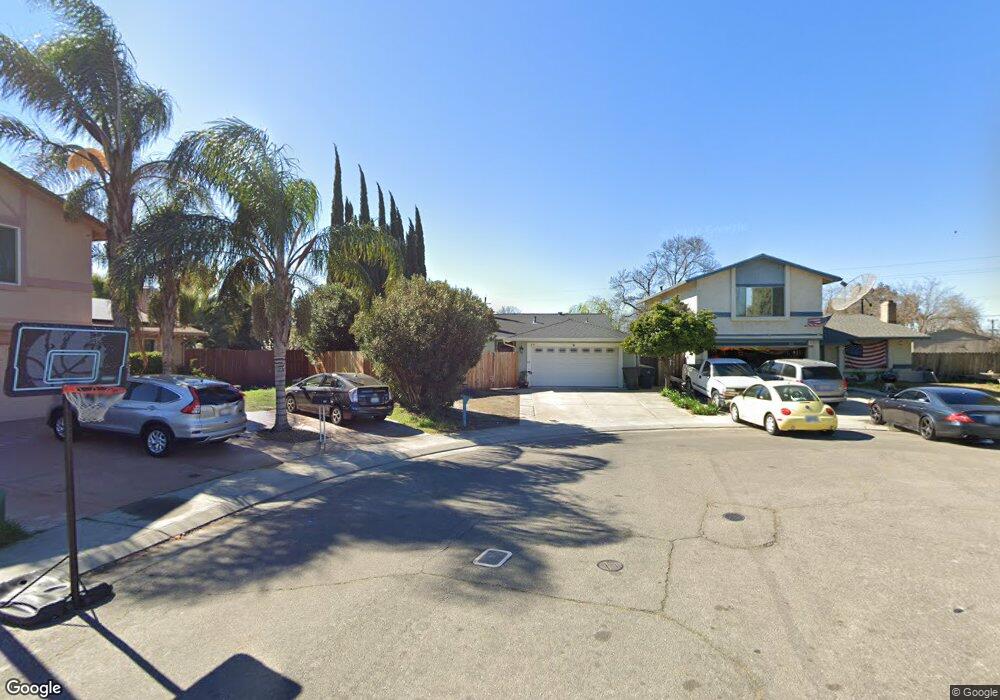
This home is located at 430 Boleyn Ct, Tracy, CA 95376 and is currently estimated at $500,040, approximately $406 per square foot. 430 Boleyn Ct is a home located in San Joaquin County with nearby schools including North Elementary School, Merrill F. West High School, and Primary Charter School.
Ownership History
Date
Name
Owned For
Owner Type
Purchase Details
Closed on
Sep 10, 2020
Sold by
Ward Christopher and Ward Kelly
Bought by
Ward Christopher D
Current Estimated Value
Home Financials for this Owner
Home Financials are based on the most recent Mortgage that was taken out on this home.
Original Mortgage
$118,212
Outstanding Balance
$84,172
Interest Rate
2.8%
Mortgage Type
New Conventional
Estimated Equity
$415,868
Purchase Details
Closed on
Jul 15, 2011
Sold by
Serrano Jaime and Serrano San Juana
Bought by
Ward Christopher
Home Financials for this Owner
Home Financials are based on the most recent Mortgage that was taken out on this home.
Original Mortgage
$134,501
Interest Rate
5.5%
Mortgage Type
FHA
Purchase Details
Closed on
Oct 7, 2003
Sold by
Serrano Jaime
Bought by
Serrano Jaime and Serrano Sanjuana Maria
Home Financials for this Owner
Home Financials are based on the most recent Mortgage that was taken out on this home.
Original Mortgage
$190,000
Interest Rate
6.4%
Mortgage Type
Purchase Money Mortgage
Purchase Details
Closed on
Mar 10, 1995
Sold by
Simmons Ed and Simmons Nancy A
Bought by
Serrano Jaime and Serrano Sanjuana Maria
Create a Home Valuation Report for This Property
The Home Valuation Report is an in-depth analysis detailing your home's value as well as a comparison with similar homes in the area
Home Values in the Area
Average Home Value in this Area
Purchase History
We collect this data history from publicly available records. To have your information removed, we recommend requesting removal directly through your county’s website.
| Date | Buyer | Sale Price | Title Company |
|---|---|---|---|
| Ward Christopher D | -- | Title365 | |
| Ward Christopher | $138,000 | Old Republic Title Company | |
| Serrano Jaime | -- | -- | |
| Serrano Jaime | -- | Alliance Title Co | |
| Serrano Jaime | $135,000 | North American Title Company |
Source: Public Records
Mortgage History
We collect this data history from publicly available records. To have your information removed, we recommend requesting removal directly through your county’s website.
| Date | Status | Borrower | Loan Amount |
|---|---|---|---|
| Open | Ward Christopher D | $118,212 | |
| Closed | Ward Christopher | $134,501 | |
| Previous Owner | Serrano Jaime | $190,000 |
Source: Public Records
Tax History
| Year | Tax Paid | Tax Assessment Tax Assessment Total Assessment is a certain percentage of the fair market value that is determined by local assessors to be the total taxable value of land and additions on the property. | Land | Improvement |
|---|---|---|---|---|
| 2025 | $2,151 | $173,327 | $42,701 | $130,626 |
| 2024 | $1,993 | $169,929 | $41,864 | $128,065 |
| 2023 | $1,960 | $166,598 | $41,044 | $125,554 |
| 2022 | $1,919 | $163,333 | $40,240 | $123,093 |
| 2021 | $1,895 | $160,131 | $39,451 | $120,680 |
| 2020 | $1,883 | $158,490 | $39,047 | $119,443 |
| 2019 | $1,856 | $155,383 | $38,282 | $117,101 |
| 2018 | $1,824 | $152,337 | $37,532 | $114,805 |
| 2017 | $1,739 | $149,351 | $36,797 | $112,554 |
| 2016 | $1,759 | $146,422 | $36,075 | $110,347 |
| 2014 | $1,537 | $141,399 | $34,837 | $106,562 |
Source: Public Records
Map
Nearby Homes
- 360 E Grant Line Rd Unit 11
- 360 E Grant Line Rd Unit 19 A
- 2100 Deborah St
- 2929 N Macarthur Dr Unit 157
- 2929 N Macarthur Dr Unit 173
- 2904 Balboa Dr
- 471 Pombo Square Dr
- 251 Ramona Way
- 181 Laguna Dr
- 3453 Bungalows Dr
- 41 W Kavanagh Ave
- 222 Pereira Ave
- 252 W Clover Rd Unit A
- 473 W Kavanagh Ave
- 335 W Clover Rd
- 1940 Wall St
- 1465 Franklin Ave
- 1930 Wall St
- 1635 Court Dr
- 3241 Arnaudo Ln
Your Personal Tour Guide
Ask me questions while you tour the home.