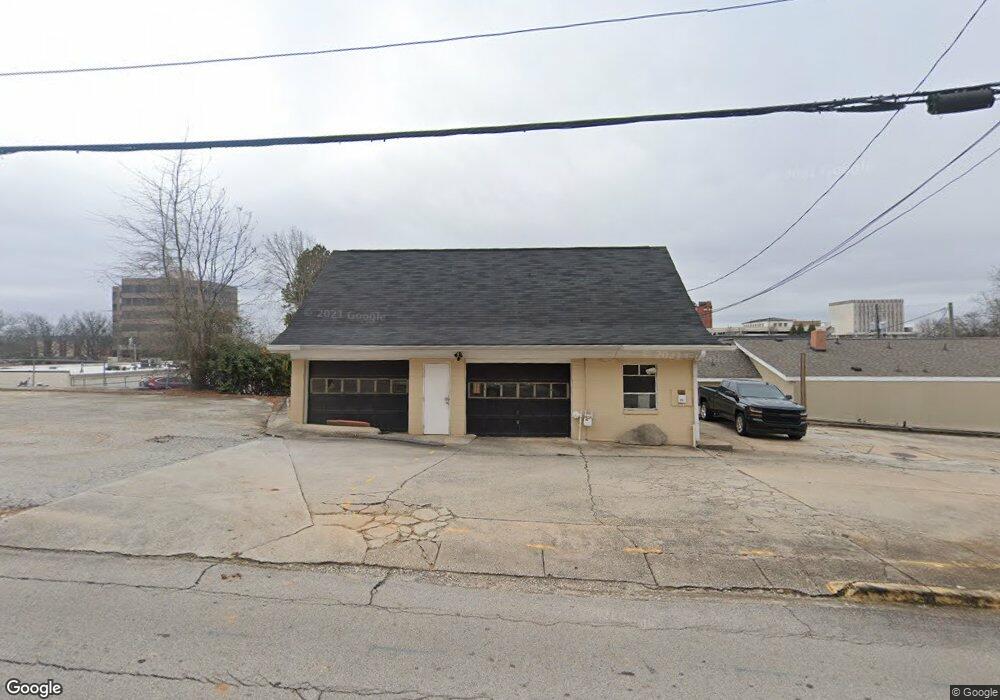
430 Broad St SE Gainesville, GA 30501
Central Core NeighborhoodEstimated Value: $532,138
Studio
--
Bath
6,660
Sq Ft
$80/Sq Ft
Est. Value
About This Home
This home is located at 430 Broad St SE, Gainesville, GA 30501 and is currently estimated at $532,138, approximately $79 per square foot. 430 Broad St SE is a home located in Hall County with nearby schools including Enota Multiple Intelligences Academy, Gainesville Middle School, and Gainesville High School.
Ownership History
Date
Name
Owned For
Owner Type
Purchase Details
Closed on
Mar 17, 2023
Sold by
Greek Tavern Llc
Bought by
Greek Tavern Properties Llc
Current Estimated Value
Purchase Details
Closed on
Dec 17, 2021
Sold by
Franze Properties Ii Llc
Bought by
Greek Tavern Llc
Home Financials for this Owner
Home Financials are based on the most recent Mortgage that was taken out on this home.
Original Mortgage
$432,500
Interest Rate
3.11%
Mortgage Type
New Conventional
Purchase Details
Closed on
Nov 19, 2019
Sold by
Dixon Frances
Bought by
Franze Properties Ii Llc
Purchase Details
Closed on
Apr 5, 2017
Sold by
Dixon Frances M
Bought by
Mitchell Donald Stuart
Purchase Details
Closed on
Jun 24, 1998
Sold by
Nealy Robert J and Nealy Dallis Elaine
Bought by
Dixon Frances
Home Financials for this Owner
Home Financials are based on the most recent Mortgage that was taken out on this home.
Original Mortgage
$157,000
Interest Rate
7.1%
Mortgage Type
Commercial
Create a Home Valuation Report for This Property
The Home Valuation Report is an in-depth analysis detailing your home's value as well as a comparison with similar homes in the area
Home Values in the Area
Average Home Value in this Area
Purchase History
| Date | Buyer | Sale Price | Title Company |
|---|---|---|---|
| Greek Tavern Properties Llc | -- | -- | |
| Greek Tavern Llc | $432,500 | -- | |
| Franze Properties Ii Llc | $350,000 | -- | |
| Mitchell Donald Stuart | $145,000 | -- | |
| Dixon Frances | $165,000 | -- |
Source: Public Records
Mortgage History
| Date | Status | Borrower | Loan Amount |
|---|---|---|---|
| Previous Owner | Greek Tavern Llc | $432,500 | |
| Previous Owner | Dixon Frances | $157,000 |
Source: Public Records
Tax History
| Year | Tax Paid | Tax Assessment Tax Assessment Total Assessment is a certain percentage of the fair market value that is determined by local assessors to be the total taxable value of land and additions on the property. | Land | Improvement |
|---|---|---|---|---|
| 2025 | $9,970 | $350,656 | $194,440 | $156,216 |
| 2024 | $4,950 | $172,840 | $172,840 | $0 |
| 2023 | $330 | $82,240 | $82,240 | $0 |
| 2022 | $487 | $103,320 | $66,320 | $37,000 |
| 2021 | $538 | $103,320 | $66,320 | $37,000 |
| 2020 | $3,106 | $103,320 | $66,320 | $37,000 |
| 2019 | $2,815 | $92,280 | $55,280 | $37,000 |
| 2018 | $542 | $91,320 | $55,280 | $36,040 |
| 2017 | $612 | $91,320 | $55,280 | $36,040 |
| 2016 | $2,766 | $91,320 | $55,280 | $36,040 |
| 2015 | $1,387 | $91,320 | $55,280 | $36,040 |
| 2014 | $1,387 | $71,477 | $46,320 | $25,157 |
Source: Public Records
Map
Nearby Homes
- 358 Clarendon Ct SE
- 354 Clarendon Ct SE
- 405 Forrest Ln
- 368 Forrest Ave
- 380 Forrest Ave
- 515 Nightfire Ct SW
- 510 Nightfire Ct SW
- 372 Forrest Ave
- 430 Forrest Ave
- 610 Candler St
- 425 North Ave Unit B
- 605 Candler St Unit C8
- 605 Candler St Unit B15
- 605 Candler St Unit A6
- 890 Candler St Unit 12
- 549 Park Street Place
- 401 Ridgewood Ave
- 1049 Desota St SE
- 00 Jesse Jewell Pkwy
- 705 Oak St
- 420 Broad St SE
- 406 Broad St SE
- 333 Jesse Jewell Pkwy SE Unit B & C
- 333 Jesse Jewell Pkwy SE
- 500 Spring St SE
- 302 Broad St SE
- 316 Spring St SE
- 435 Spring St SE
- 340 Jesse Jewell Pkwy
- 486 Washington St SE Unit 486
- 486 Washington St SE Unit 522
- 486 Washington St SE
- 441 Ee Butler Pkwy
- 549 Watson Place SE
- 129 Athens Hwy
- 335 Washington St SE
- 209 Jesse Jewell Pkwy SE
- 621 Spring St SE
- 451 Ee Butler Pkwy
- 405 Washington St NE
Your Personal Tour Guide
Ask me questions while you tour the home.