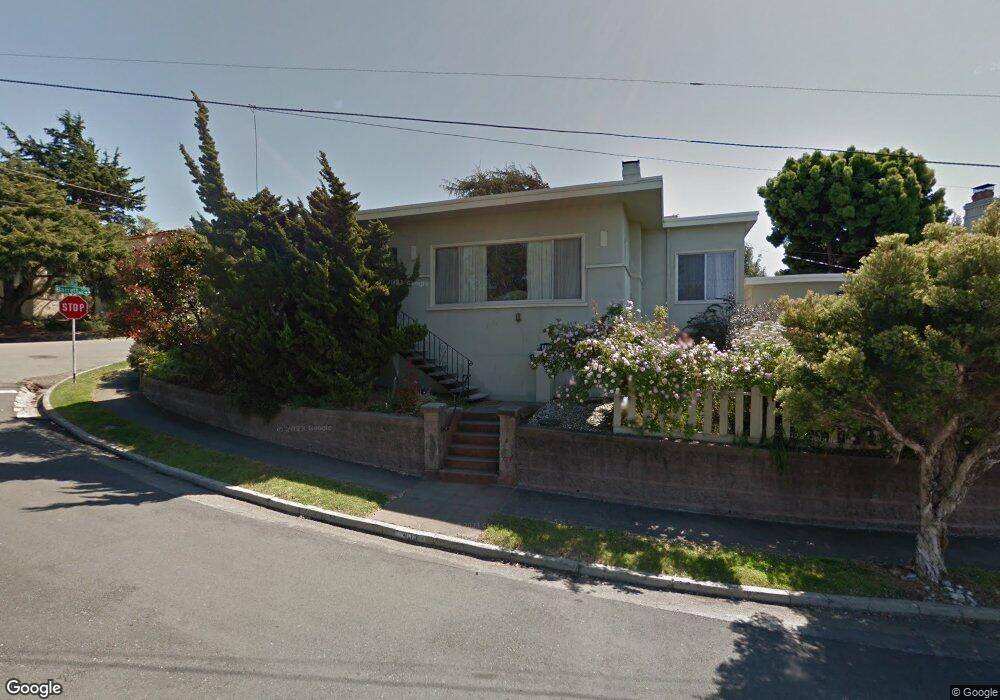
430 Dimm St Richmond, CA 94805
East Richmond NeighborhoodEstimated Value: $789,000 - $932,000
2
Beds
2
Baths
1,717
Sq Ft
$490/Sq Ft
Est. Value
About This Home
This home is located at 430 Dimm St, Richmond, CA 94805 and is currently estimated at $841,585, approximately $490 per square foot. 430 Dimm St is a home located in Contra Costa County with nearby schools including Mira Vista Elementary School, Fred T. Korematsu Middle School, and El Cerrito Senior High School.
Ownership History
Date
Name
Owned For
Owner Type
Purchase Details
Closed on
Dec 31, 2007
Sold by
Bhatia Nilima
Bought by
Bhatia Nilima and Gelberg Steven J
Current Estimated Value
Purchase Details
Closed on
Dec 12, 2002
Sold by
Gelberg Steven J
Bought by
Bhatia Nilima
Home Financials for this Owner
Home Financials are based on the most recent Mortgage that was taken out on this home.
Original Mortgage
$137,200
Interest Rate
6.03%
Mortgage Type
Purchase Money Mortgage
Purchase Details
Closed on
Oct 24, 1997
Sold by
Lloyd Dicely and Morris Robert Morris
Bought by
Bhatia Nilima
Home Financials for this Owner
Home Financials are based on the most recent Mortgage that was taken out on this home.
Original Mortgage
$153,600
Interest Rate
7.36%
Mortgage Type
Purchase Money Mortgage
Create a Home Valuation Report for This Property
The Home Valuation Report is an in-depth analysis detailing your home's value as well as a comparison with similar homes in the area
Home Values in the Area
Average Home Value in this Area
Purchase History
| Date | Buyer | Sale Price | Title Company |
|---|---|---|---|
| Bhatia Nilima | -- | None Available | |
| Bhatia Nilima | -- | Old Republic Title | |
| Bhatia Nilima | $192,000 | Old Republic Title Company |
Source: Public Records
Mortgage History
| Date | Status | Borrower | Loan Amount |
|---|---|---|---|
| Closed | Bhatia Nilima | $137,200 | |
| Previous Owner | Bhatia Nilima | $153,600 |
Source: Public Records
Tax History Compared to Growth
Tax History
| Year | Tax Paid | Tax Assessment Tax Assessment Total Assessment is a certain percentage of the fair market value that is determined by local assessors to be the total taxable value of land and additions on the property. | Land | Improvement |
|---|---|---|---|---|
| 2025 | $5,682 | $306,546 | $144,093 | $162,453 |
| 2024 | $5,624 | $300,536 | $141,268 | $159,268 |
| 2023 | $5,624 | $294,645 | $138,499 | $156,146 |
| 2022 | $5,504 | $288,869 | $135,784 | $153,085 |
| 2021 | $5,428 | $283,206 | $133,122 | $150,084 |
| 2019 | $5,096 | $274,808 | $129,174 | $145,634 |
| 2018 | $4,914 | $269,421 | $126,642 | $142,779 |
| 2017 | $4,793 | $264,139 | $124,159 | $139,980 |
| 2016 | $4,715 | $258,961 | $121,725 | $137,236 |
| 2015 | $4,678 | $255,072 | $119,897 | $135,175 |
| 2014 | $4,631 | $250,077 | $117,549 | $132,528 |
Source: Public Records
Map
Nearby Homes
- 495 Key Blvd
- 527 Mclaughlin St
- 418 Wilson Ave
- 604 Key Blvd
- 2530 Edwards Ave
- 9 S 45th St
- 680 Mclaughlin St
- 556 41st St
- 250 S 47th St
- 2063 Tapscott Ave
- 4026 Roosevelt Ave
- 2021 Key Blvd
- 1909 Francisco Way
- 5419 Solano Ave
- 4225 Taft Ave
- 3811 Clinton Ave
- 12664 San Pablo Ave
- 3834 Waller Ave
- 1769 Walnut St
- 6620 Hill St