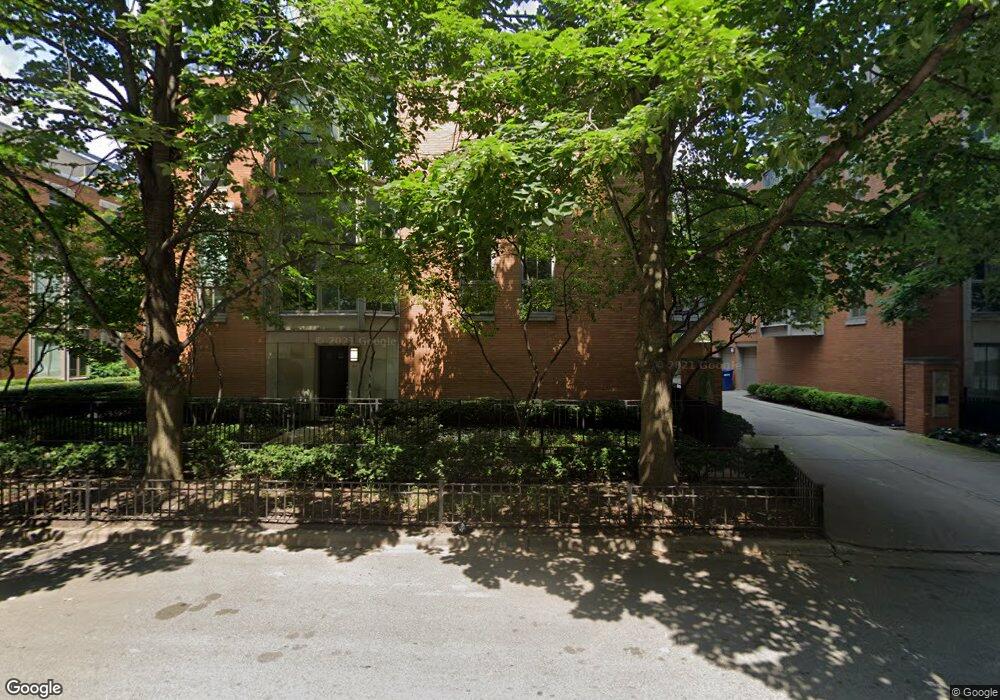
430 E North Water St Chicago, IL 60611
Streeterville NeighborhoodEstimated Value: $1,111,000 - $1,839,000
3
Beds
4
Baths
2,358
Sq Ft
$592/Sq Ft
Est. Value
About This Home
This home is located at 430 E North Water St, Chicago, IL 60611 and is currently estimated at $1,394,985, approximately $591 per square foot. 430 E North Water St is a home located in Cook County with nearby schools including Ogden Elementary School, Wells Community Academy High School, and Chicago International Charter School.
Ownership History
Date
Name
Owned For
Owner Type
Purchase Details
Closed on
Dec 15, 2017
Sold by
Laurence Booth Family L P
Bought by
Mcginnis John O and Spence Ardith A
Current Estimated Value
Home Financials for this Owner
Home Financials are based on the most recent Mortgage that was taken out on this home.
Original Mortgage
$825,000
Outstanding Balance
$688,934
Interest Rate
3.9%
Mortgage Type
Adjustable Rate Mortgage/ARM
Estimated Equity
$706,051
Purchase Details
Closed on
Oct 1, 2007
Sold by
Cdct Land Co Llc
Bought by
Laurence Booth Family Lp
Home Financials for this Owner
Home Financials are based on the most recent Mortgage that was taken out on this home.
Original Mortgage
$250,000
Interest Rate
7.12%
Mortgage Type
Unknown
Purchase Details
Closed on
Aug 28, 2006
Sold by
Booth Patricia
Bought by
Laurence Booth Family Lp
Create a Home Valuation Report for This Property
The Home Valuation Report is an in-depth analysis detailing your home's value as well as a comparison with similar homes in the area
Home Values in the Area
Average Home Value in this Area
Purchase History
| Date | Buyer | Sale Price | Title Company |
|---|---|---|---|
| Mcginnis John O | $1,395,000 | Near North National Title | |
| Laurence Booth Family Lp | $255,500 | None Available | |
| Laurence Booth Family Lp | -- | None Available |
Source: Public Records
Mortgage History
| Date | Status | Borrower | Loan Amount |
|---|---|---|---|
| Open | Mcginnis John O | $825,000 | |
| Previous Owner | Laurence Booth Family Lp | $250,000 |
Source: Public Records
Tax History
| Year | Tax Paid | Tax Assessment Tax Assessment Total Assessment is a certain percentage of the fair market value that is determined by local assessors to be the total taxable value of land and additions on the property. | Land | Improvement |
|---|---|---|---|---|
| 2025 | $19,418 | $105,000 | $25,563 | $79,437 |
| 2024 | $19,418 | $105,000 | $25,563 | $79,437 |
| 2023 | $19,453 | $98,000 | $20,615 | $77,385 |
| 2022 | $19,453 | $98,000 | $20,615 | $77,385 |
| 2021 | $19,037 | $98,000 | $20,615 | $77,385 |
| 2020 | $22,499 | $104,098 | $15,903 | $88,195 |
| 2019 | $22,733 | $113,151 | $15,903 | $97,248 |
| 2018 | $22,351 | $113,151 | $15,903 | $97,248 |
| 2017 | $20,963 | $97,380 | $13,547 | $83,833 |
| 2016 | $19,504 | $97,380 | $13,547 | $83,833 |
| 2015 | $17,845 | $97,380 | $13,547 | $83,833 |
| 2014 | $13,364 | $72,026 | $11,191 | $60,835 |
| 2013 | $13,100 | $72,026 | $11,191 | $60,835 |
Source: Public Records
Map
Nearby Homes
- 438 E North Water St
- 415 E North Water St Unit 1403
- 415 E North Water St Unit 3205
- 474 N Lake Shore Dr Unit 5008
- 474 N Lake Shore Dr Unit 4104
- 474 N Lake Shore Dr Unit 4607
- 474 N Lake Shore Dr Unit 3307
- 474 N Lake Shore Dr Unit 2703
- 474 N Lake Shore Dr Unit 4205
- 474 N Lake Shore Dr Unit 4309
- 474 N Lake Shore Dr Unit PS286
- 474 N Lake Shore Dr Unit 3609
- 474 N Lake Shore Dr Unit 4206
- 474 N Lake Shore Dr Unit 5207
- 474 N Lake Shore Dr Unit 2301
- 474 N Lake Shore Dr Unit 2212
- 474 N Lake Shore Dr Unit 3305
- 474 N Lake Shore Dr Unit 1909
- 474 N Lake Shore Dr Unit 2407
- 474 N Lake Shore Dr Unit 2002
- 430 E North Water St Unit B
- 430 E North Water St
- 430 E North Water St
- 430 E North Water St
- 430 E North Water St
- 430 E North Water St
- 430 E North Water St
- 430 E North Water St
- 430 E North Water St Unit D
- 430 E North Water St Unit E
- 430 E North Water St Unit H
- 430 E North Water St Unit E
- 430 E North Water St Unit G
- 440 E North Water St
- 438 E North Water St Unit 4452308
- 424 E North Water St
- 424 E North Water St
- 424 E North Water St
- 424 E North Water St
- 424 E North Water St
Your Personal Tour Guide
Ask me questions while you tour the home.