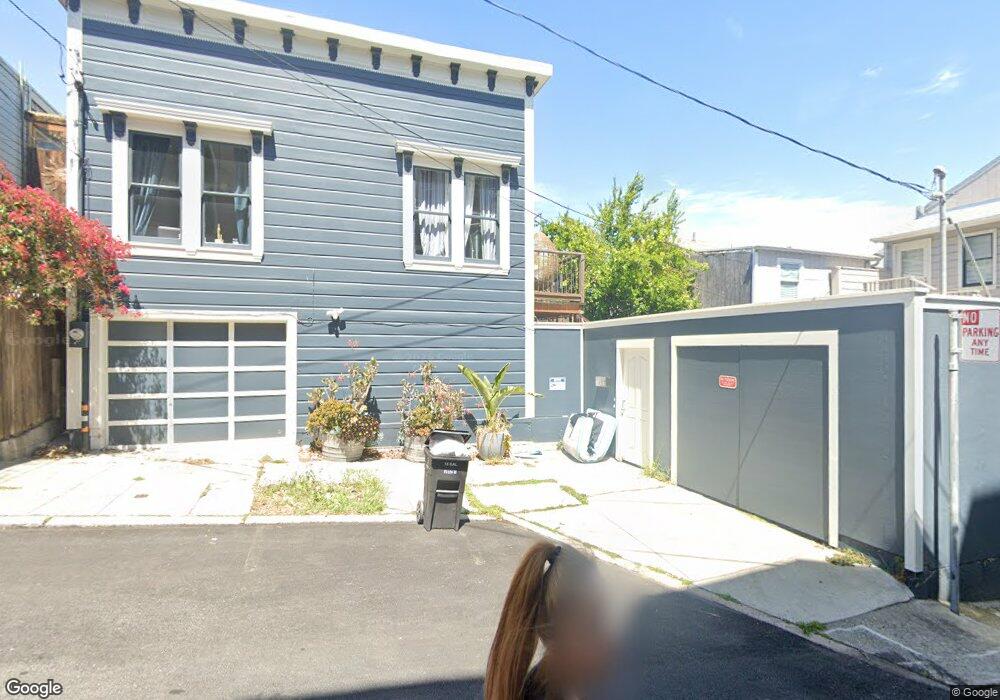
430 Hickory St San Francisco, CA 94102
Hayes Valley NeighborhoodEstimated Value: $1,450,000 - $1,976,921
4
Beds
3
Baths
1,280
Sq Ft
$1,329/Sq Ft
Est. Value
About This Home
This home is located at 430 Hickory St, San Francisco, CA 94102 and is currently estimated at $1,701,230, approximately $1,329 per square foot. 430 Hickory St is a home located in San Francisco County with nearby schools including Muir (John) Elementary School, James Lick Middle School, and Gateway Middle School.
Ownership History
Date
Name
Owned For
Owner Type
Purchase Details
Closed on
Dec 8, 2020
Sold by
Perez Maria Antonia
Bought by
Perez J Robert
Current Estimated Value
Home Financials for this Owner
Home Financials are based on the most recent Mortgage that was taken out on this home.
Original Mortgage
$1,336,800
Outstanding Balance
$1,189,562
Interest Rate
2.8%
Mortgage Type
New Conventional
Estimated Equity
$511,668
Purchase Details
Closed on
Nov 19, 2020
Sold by
Canotas Louis and Mary Wallace Trust
Bought by
Perez Robert Jon and Rivera Mayra Perez
Home Financials for this Owner
Home Financials are based on the most recent Mortgage that was taken out on this home.
Original Mortgage
$1,336,800
Outstanding Balance
$1,189,562
Interest Rate
2.8%
Mortgage Type
New Conventional
Estimated Equity
$511,668
Purchase Details
Closed on
Jun 24, 1999
Sold by
Dudum Helen G
Bought by
Dudum Basim N and Dudum Jeanette B
Create a Home Valuation Report for This Property
The Home Valuation Report is an in-depth analysis detailing your home's value as well as a comparison with similar homes in the area
Home Values in the Area
Average Home Value in this Area
Purchase History
| Date | Buyer | Sale Price | Title Company |
|---|---|---|---|
| Perez J Robert | -- | Chicago Title Company | |
| Perez Robert Jon | -- | Chicago Title | |
| Dudum Basim N | $250,000 | Old Republic Title Company |
Source: Public Records
Mortgage History
| Date | Status | Borrower | Loan Amount |
|---|---|---|---|
| Open | Perez Robert Jon | $1,336,800 |
Source: Public Records
Tax History Compared to Growth
Tax History
| Year | Tax Paid | Tax Assessment Tax Assessment Total Assessment is a certain percentage of the fair market value that is determined by local assessors to be the total taxable value of land and additions on the property. | Land | Improvement |
|---|---|---|---|---|
| 2025 | $21,562 | $1,808,737 | $1,266,117 | $542,620 |
| 2024 | $21,562 | $1,773,273 | $1,241,292 | $531,981 |
| 2023 | $21,240 | $1,738,505 | $1,216,954 | $521,551 |
| 2022 | $20,840 | $1,704,418 | $1,193,093 | $511,325 |
| 2021 | $20,473 | $1,671,000 | $1,169,700 | $501,300 |
| 2020 | $4,288 | $303,002 | $155,388 | $147,614 |
| 2019 | $4,144 | $297,062 | $152,342 | $144,720 |
| 2018 | $4,004 | $291,240 | $149,356 | $141,884 |
| 2017 | $3,657 | $285,530 | $146,428 | $139,102 |
| 2016 | $3,570 | $279,934 | $143,558 | $136,376 |
| 2015 | $3,523 | $275,730 | $141,402 | $134,328 |
| 2014 | $3,431 | $270,332 | $138,634 | $131,698 |
Source: Public Records
Map
Nearby Homes
- 610 Buchanan St Unit 1
- 462-466 Linden St
- 469 Ivy St
- 163 Octavia St
- 675-677 Ivy St
- 675 Ivy St Unit 677
- 450 Hayes St Unit 3H
- 538 Page St
- 536 Page St
- 430 Hayes St Unit 201
- 615-617 Octavia St
- 295 Buchanan St
- 47 Octavia St
- 555 Fulton St Unit 518
- 555 Fulton St Unit 427
- 555 Fulton St Unit 322
- 385 Haight St
- 55 Page St Unit 514
- 55 Page St Unit 219
- 145 Buchanan St
- 434 Hickory St
- 525 Fell St
- 419 Laguna St Unit 2
- 419 Laguna St Unit 1
- 419 Laguna St
- 421 Hickory St Unit 425
- 517 Fell St
- 535 Fell St
- 415 Laguna St Unit 417
- 415 Laguna St Unit 417
- 529 Fell St Unit 531
- 549 Fell St
- 511 Fell St
- 405 Laguna St
- 428 Oak St
- 557 Fell St
- 421 Laguna St
- 555 Fell St Unit 557
- 436 Oak St
- 501 Fell St