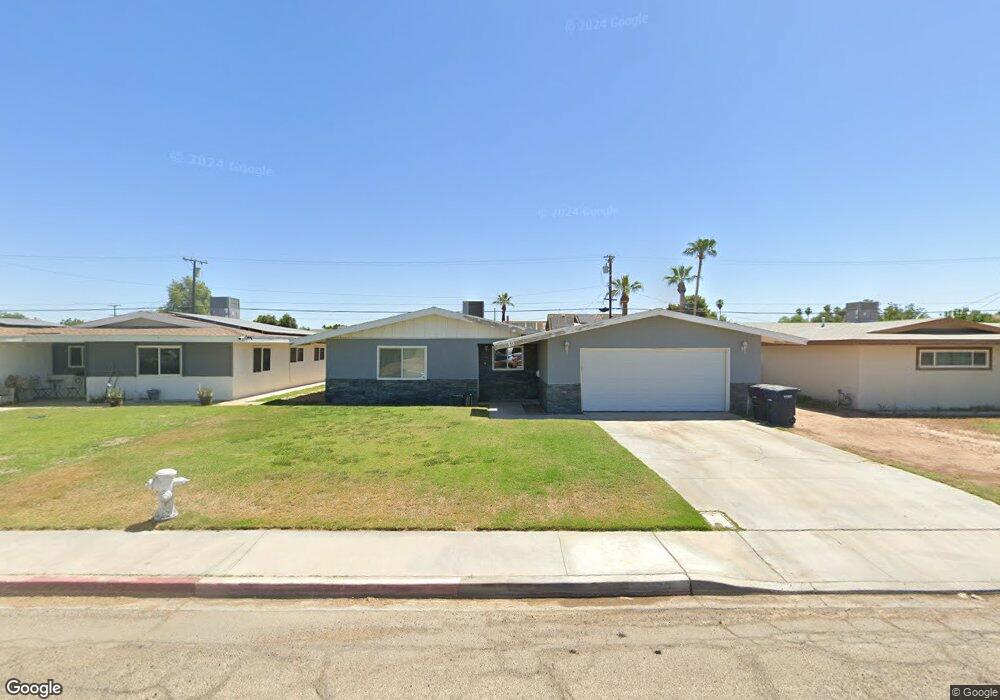
430 N 9th St Blythe, CA 92225
Estimated Value: $175,000 - $229,000
4
Beds
2
Baths
1,571
Sq Ft
$135/Sq Ft
Est. Value
About This Home
This home is located at 430 N 9th St, Blythe, CA 92225 and is currently estimated at $212,043, approximately $134 per square foot. 430 N 9th St is a home located in Riverside County with nearby schools including Palo Verde High School and Scale Leadership Academy - East.
Ownership History
Date
Name
Owned For
Owner Type
Purchase Details
Closed on
Jul 18, 2025
Sold by
Barrozo Robert and Barrozo Betty Lou
Bought by
Palo Verde Irrigation District
Current Estimated Value
Purchase Details
Closed on
Jul 19, 2024
Sold by
Barrozo Robert and Barrozo Berry Lou
Bought by
Palo Verde Irrigation District
Purchase Details
Closed on
Oct 10, 2023
Sold by
Barrozo Betty Lou and Barrozo Robert
Bought by
Palo Verde Irrigation District
Purchase Details
Closed on
Jul 15, 2022
Sold by
Robert Barrozo
Bought by
Palo Verde Irrigation District
Create a Home Valuation Report for This Property
The Home Valuation Report is an in-depth analysis detailing your home's value as well as a comparison with similar homes in the area
Home Values in the Area
Average Home Value in this Area
Purchase History
| Date | Buyer | Sale Price | Title Company |
|---|---|---|---|
| Palo Verde Irrigation District | -- | -- | |
| Palo Verde Irrigation District | -- | -- | |
| Palo Verde Irrigation District | -- | -- | |
| Palo Verde Irrigation District | -- | -- |
Source: Public Records
Tax History
| Year | Tax Paid | Tax Assessment Tax Assessment Total Assessment is a certain percentage of the fair market value that is determined by local assessors to be the total taxable value of land and additions on the property. | Land | Improvement |
|---|---|---|---|---|
| 2025 | $683 | $68,011 | $10,696 | $57,315 |
| 2023 | $669 | $65,373 | $10,282 | $55,091 |
| 2022 | $653 | $64,087 | $10,078 | $54,009 |
| 2021 | $635 | $62,831 | $9,881 | $52,950 |
| 2020 | $628 | $62,188 | $9,780 | $52,408 |
| 2019 | $621 | $60,970 | $9,589 | $51,381 |
| 2018 | $581 | $59,775 | $9,402 | $50,373 |
| 2017 | $568 | $58,604 | $9,218 | $49,386 |
| 2016 | $561 | $57,456 | $9,038 | $48,418 |
| 2015 | $554 | $56,595 | $8,903 | $47,692 |
| 2014 | $532 | $55,488 | $8,730 | $46,758 |
Source: Public Records
Map
Nearby Homes
Your Personal Tour Guide
Ask me questions while you tour the home.