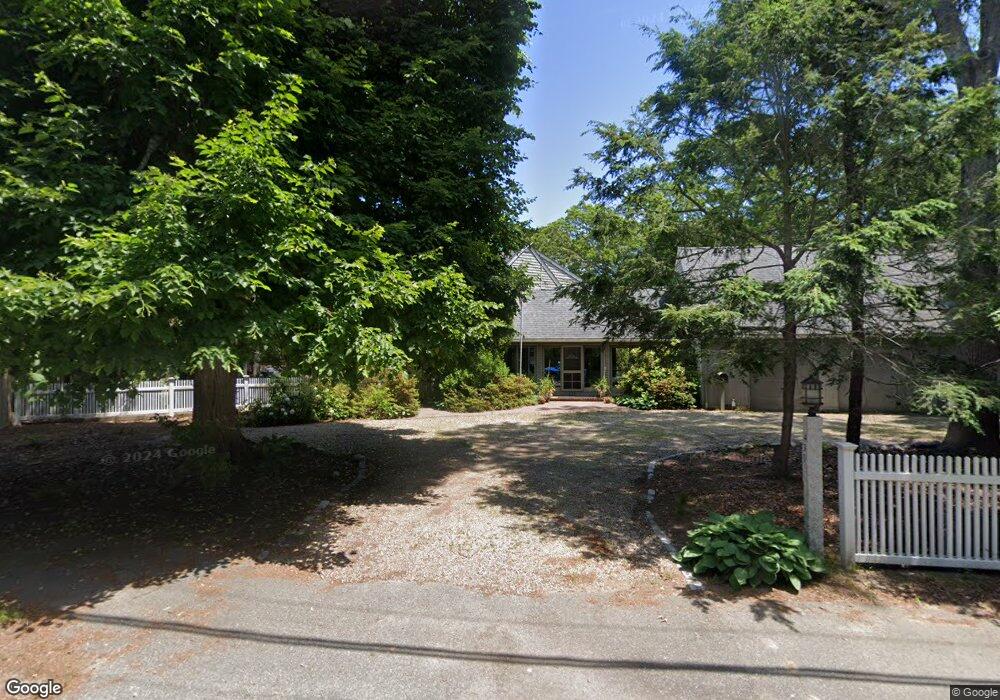
430 Old Oyster Rd Cotuit, MA 02635
Cotuit NeighborhoodEstimated Value: $1,203,000 - $1,942,000
5
Beds
5
Baths
4,167
Sq Ft
$346/Sq Ft
Est. Value
About This Home
This home is located at 430 Old Oyster Rd, Cotuit, MA 02635 and is currently estimated at $1,442,005, approximately $346 per square foot. 430 Old Oyster Rd is a home located in Barnstable County with nearby schools including West Villages Elementary School, Barnstable United Elementary School, and Barnstable Intermediate School.
Ownership History
Date
Name
Owned For
Owner Type
Purchase Details
Closed on
Mar 15, 1971
Bought by
Johnston Jeffrey and Johnston Martha
Current Estimated Value
Create a Home Valuation Report for This Property
The Home Valuation Report is an in-depth analysis detailing your home's value as well as a comparison with similar homes in the area
Home Values in the Area
Average Home Value in this Area
Purchase History
| Date | Buyer | Sale Price | Title Company |
|---|---|---|---|
| Johnston Jeffrey | -- | -- |
Source: Public Records
Mortgage History
| Date | Status | Borrower | Loan Amount |
|---|---|---|---|
| Open | Johnston Jeffrey | $84,075 | |
| Closed | Johnston Jeffrey | $70,000 | |
| Closed | Johnston Jeffrey | $40,000 | |
| Closed | Johnston Jeffrey | $95,500 |
Source: Public Records
Tax History
| Year | Tax Paid | Tax Assessment Tax Assessment Total Assessment is a certain percentage of the fair market value that is determined by local assessors to be the total taxable value of land and additions on the property. | Land | Improvement |
|---|---|---|---|---|
| 2025 | $8,849 | $1,059,800 | $241,800 | $818,000 |
| 2024 | $7,844 | $995,400 | $241,800 | $753,600 |
| 2023 | $7,431 | $887,800 | $219,900 | $667,900 |
| 2022 | $7,434 | $719,000 | $151,200 | $567,800 |
| 2021 | $7,108 | $643,800 | $153,600 | $490,200 |
| 2020 | $6,974 | $595,600 | $153,600 | $442,000 |
| 2019 | $3,096 | $556,000 | $162,900 | $393,100 |
| 2018 | $6,338 | $533,500 | $189,800 | $343,700 |
| 2017 | $6,107 | $517,500 | $189,800 | $327,700 |
| 2016 | $5,903 | $512,900 | $185,200 | $327,700 |
| 2015 | $6,064 | $526,400 | $188,000 | $338,400 |
Source: Public Records
Map
Nearby Homes
- 10 Abbey Gate Rd
- 1820 Santuit Newtown Rd
- 7 Oxford Dr
- 552 Main St
- 226 Dunrobin Rd
- 239 Oxford Dr
- 70 Cape Dr Unit 14D
- 70 Cape Dr Unit 15D
- 70 Cape Dr Unit 11D
- 70 Cape Dr Unit 15D
- 70 Cape Dr Unit 11D
- 1597 Santuit-Newtown Rd
- 75 Bob White Run
- 15 Riverview Ave Unit D
- 15 Riverview Ave Unit D
- 70 Simons Rd Unit E
- 70 Simons Rd
- 804 Main St
- 181 School St
- 602 Putnam Ave
Your Personal Tour Guide
Ask me questions while you tour the home.