
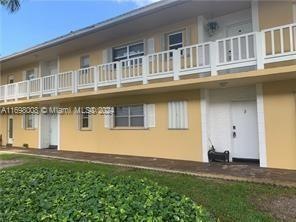
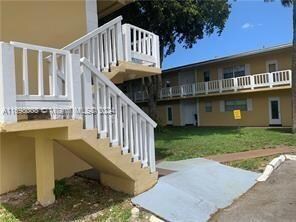
430 SE 2nd Ave Unit 3 Deerfield Beach, FL 33441
2
Beds
1
Bath
840
Sq Ft
1973
Built
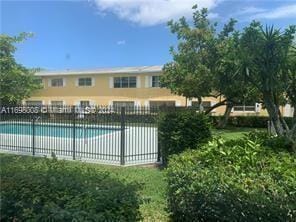
Highlights
- Main Floor Bedroom
- Community Center
- Central Heating and Cooling System
- Garden View
- Ceramic Tile Flooring
- 1 Car Garage
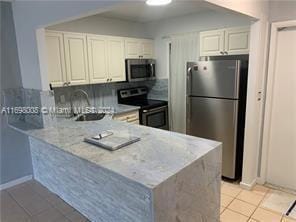
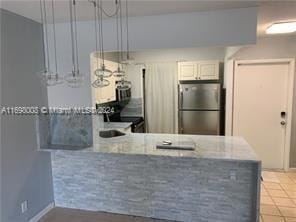
About This Home
As of June 2025Great unit
Fully renovated
Easy to show
Last Agent to Sell the Property
Virtualty Real Estate License #3259935 Listed on: 11/21/2024
Property Details
Home Type
- Condominium
Est. Annual Taxes
- $3,946
Year Built
- Built in 1973
Parking
- 1 Car Garage
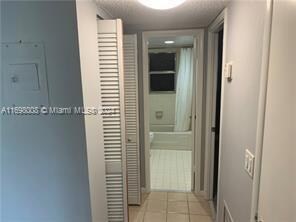
Interior Spaces
- 840 Sq Ft Home
- 2-Story Property
- Ceramic Tile Flooring
- Garden Views
Kitchen
- <<microwave>>
- Dishwasher
- Disposal
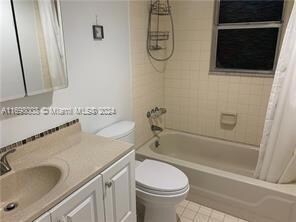
Bedrooms and Bathrooms
- 2 Bedrooms
- Main Floor Bedroom
- 1 Full Bathroom
Utilities
- Central Heating and Cooling System
Listing and Financial Details
- Assessor Parcel Number 484306DG0490
Community Details
Overview
- Property has a Home Owners Association
- Sequoia Gardens Condos
- Sequoia Gardens Iii Condo Subdivision
Amenities
- Community Center
- Party Room
- Interior Hall
Pet Policy
- No Pets Allowed
Ownership History
Date
Name
Owned For
Owner Type
Purchase Details
Listed on
Nov 21, 2024
Closed on
Jun 27, 2025
Sold by
Palm Swings Llc
Bought by
Visbal Alvaro Antonio
Seller's Agent
Karina Hazan
Virtualty Real Estate
Buyer's Agent
Hector Jimenez
Avenew Realty Corp
List Price
$215,000
Sold Price
$160,000
Premium/Discount to List
-$55,000
-25.58%
Views
52
Home Financials for this Owner
Home Financials are based on the most recent Mortgage that was taken out on this home.
Avg. Annual Appreciation
4200.91%
Purchase Details
Listed on
May 20, 2021
Closed on
May 14, 2021
Sold by
Ferraz Handrickson Stewart
Bought by
Palm Swings Llc
Seller's Agent
Daniel Travis
State Street Realty Group
Buyer's Agent
Suzanne Vazquez PA
Select Homes Realty Group LLC
Sold Price
$1,400
Home Financials for this Owner
Home Financials are based on the most recent Mortgage that was taken out on this home.
Avg. Annual Appreciation
2.16%
Purchase Details
Closed on
Mar 22, 2018
Sold by
Ferraz Filho Edivar
Bought by
Ferrz Handrickson Stewart
Purchase Details
Listed on
Jan 30, 2017
Closed on
Mar 10, 2017
Sold by
St Amand Kenneth P
Bought by
Filho Edivar Ferraz
Seller's Agent
Dana Barkett
The Keyes Company
Buyer's Agent
Vito Heiderick
VH 1 Realty Corp
List Price
$99,000
Sold Price
$95,000
Premium/Discount to List
-$4,000
-4.04%
Home Financials for this Owner
Home Financials are based on the most recent Mortgage that was taken out on this home.
Avg. Annual Appreciation
8.86%
Purchase Details
Closed on
Dec 1, 1987
Sold by
Available Not
Bought by
Available Not
Similar Homes in Deerfield Beach, FL
Create a Home Valuation Report for This Property
The Home Valuation Report is an in-depth analysis detailing your home's value as well as a comparison with similar homes in the area
Home Values in the Area
Average Home Value in this Area
Purchase History
| Date | Type | Sale Price | Title Company |
|---|---|---|---|
| Warranty Deed | $160,000 | Title Team | |
| Warranty Deed | $146,500 | Attorney | |
| Quit Claim Deed | -- | Attorney | |
| Warranty Deed | $95,000 | Attorney | |
| Warranty Deed | $29,857 | -- |
Source: Public Records
Property History
| Date | Event | Price | Change | Sq Ft Price |
|---|---|---|---|---|
| 07/10/2025 07/10/25 | For Rent | $1,900 | 0.0% | -- |
| 06/27/2025 06/27/25 | Sold | $160,000 | -13.5% | $190 / Sq Ft |
| 06/09/2025 06/09/25 | Pending | -- | -- | -- |
| 06/01/2025 06/01/25 | Price Changed | $185,000 | -2.1% | $220 / Sq Ft |
| 04/28/2025 04/28/25 | Price Changed | $189,000 | -0.5% | $225 / Sq Ft |
| 04/16/2025 04/16/25 | Price Changed | $190,000 | -2.6% | $226 / Sq Ft |
| 04/04/2025 04/04/25 | Price Changed | $195,000 | -2.0% | $232 / Sq Ft |
| 03/18/2025 03/18/25 | Price Changed | $199,000 | -2.9% | $237 / Sq Ft |
| 01/27/2025 01/27/25 | Price Changed | $205,000 | -2.3% | $244 / Sq Ft |
| 12/24/2024 12/24/24 | Price Changed | $209,900 | -2.4% | $250 / Sq Ft |
| 11/21/2024 11/21/24 | For Sale | $215,000 | 0.0% | $256 / Sq Ft |
| 08/01/2024 08/01/24 | Rented | $1,800 | -2.7% | -- |
| 06/28/2024 06/28/24 | For Rent | $1,850 | 0.0% | -- |
| 06/20/2024 06/20/24 | Off Market | $1,850 | -- | -- |
| 08/01/2023 08/01/23 | Rented | $1,800 | 0.0% | -- |
| 06/15/2023 06/15/23 | Under Contract | -- | -- | -- |
| 06/05/2023 06/05/23 | For Rent | $1,800 | 0.0% | -- |
| 06/05/2023 06/05/23 | Under Contract | -- | -- | -- |
| 06/02/2023 06/02/23 | For Rent | $1,800 | 0.0% | -- |
| 06/01/2023 06/01/23 | Off Market | $1,800 | -- | -- |
| 05/31/2023 05/31/23 | For Rent | $1,800 | +28.6% | -- |
| 05/20/2021 05/20/21 | For Rent | $1,400 | 0.0% | -- |
| 05/20/2021 05/20/21 | Rented | $1,400 | 0.0% | -- |
| 05/17/2021 05/17/21 | Sold | $146,500 | +1.1% | $174 / Sq Ft |
| 04/17/2021 04/17/21 | Pending | -- | -- | -- |
| 02/23/2021 02/23/21 | For Sale | $144,900 | +52.5% | $173 / Sq Ft |
| 03/10/2017 03/10/17 | Sold | $95,000 | -4.0% | $113 / Sq Ft |
| 02/08/2017 02/08/17 | Pending | -- | -- | -- |
| 01/30/2017 01/30/17 | For Sale | $99,000 | -- | $118 / Sq Ft |
Source: MIAMI REALTORS® MLS
Tax History Compared to Growth
Tax History
| Year | Tax Paid | Tax Assessment Tax Assessment Total Assessment is a certain percentage of the fair market value that is determined by local assessors to be the total taxable value of land and additions on the property. | Land | Improvement |
|---|---|---|---|---|
| 2025 | $3,946 | $176,740 | $17,670 | $159,070 |
| 2024 | $3,700 | $176,740 | $17,670 | $159,070 |
| 2023 | $3,700 | $160,030 | $0 | $0 |
| 2022 | $3,278 | $145,490 | $14,550 | $130,940 |
| 2021 | $1,352 | $96,430 | $0 | $0 |
| 2020 | $1,325 | $95,100 | $0 | $0 |
| 2019 | $1,293 | $92,970 | $9,300 | $83,670 |
| 2018 | $1,971 | $87,380 | $8,740 | $78,640 |
| 2017 | $1,838 | $79,680 | $0 | $0 |
| 2016 | -- | $76,290 | $0 | $0 |
| 2015 | -- | $70,380 | $0 | $0 |
| 2014 | -- | $28,900 | $0 | $0 |
| 2013 | $3 | $34,760 | $3,480 | $31,280 |
Source: Public Records
Agents Affiliated with this Home
-
Hector Jimenez
H
Seller's Agent in 2025
Hector Jimenez
Avenew Realty Corp
(954) 299-8834
25 Total Sales
-
Karina Hazan
K
Seller's Agent in 2025
Karina Hazan
Virtualty Real Estate
(305) 299-1761
31 Total Sales
-
Jaime Weinstein
J
Seller's Agent in 2024
Jaime Weinstein
State Street Realty Group
(954) 226-2155
-
Vito Heiderick
Seller's Agent in 2021
Vito Heiderick
VH 1 Realty Corp
(561) 929-2272
62 Total Sales
-
Daniel Travis
D
Seller's Agent in 2021
Daniel Travis
State Street Realty Group
(954) 515-6032
20 Total Sales
-
Suzanne Vazquez PA
S
Buyer's Agent in 2021
Suzanne Vazquez PA
Select Homes Realty Group LLC
(954) 263-6461
9 Total Sales
Map
Source: MIAMI REALTORS® MLS
MLS Number: A11698008
APN: 48-43-06-DG-0490
Disclaimer: Certain information contained herein is derived from information provided by parties other than Homes.com. All information provided is deemed reliable, but is not guaranteed to be accurate and should be independently verified.
![]() IDX information is provided exclusively for personal, non-commercial use, and may not be used for any purpose other than to identify prospective properties consumers may be interested in purchasing. Information is deemed reliable but not guaranteed.
IDX information is provided exclusively for personal, non-commercial use, and may not be used for any purpose other than to identify prospective properties consumers may be interested in purchasing. Information is deemed reliable but not guaranteed.
Nearby Homes
- 500 SE 2nd Ave Unit 3
- 430 SE 2nd Ave Unit 5
- 440 SE 2nd Ave Unit 21
- 310 SE 2nd Ave Unit A3
- 600 SE 2nd Ave Unit K4
- 367 SE 1st Way
- 374 SE 1st Dr
- 366 SE 1st Dr
- 370 SE 2nd Ave Unit G3
- 168 SE 5th Ct
- 164 SE 5th Ct
- 166 SE 5th Ct
- 401 SE 4th St
- 340 SE 2nd Ave Unit D4
- 330 SE 2nd Ave Unit C2
- 303 SE 3rd Terrace
- 520 SE 3rd Ct
- 700 SE 2nd Ave Unit 311
- 541 SE 4th St
- 120 SE 7th St Unit 5