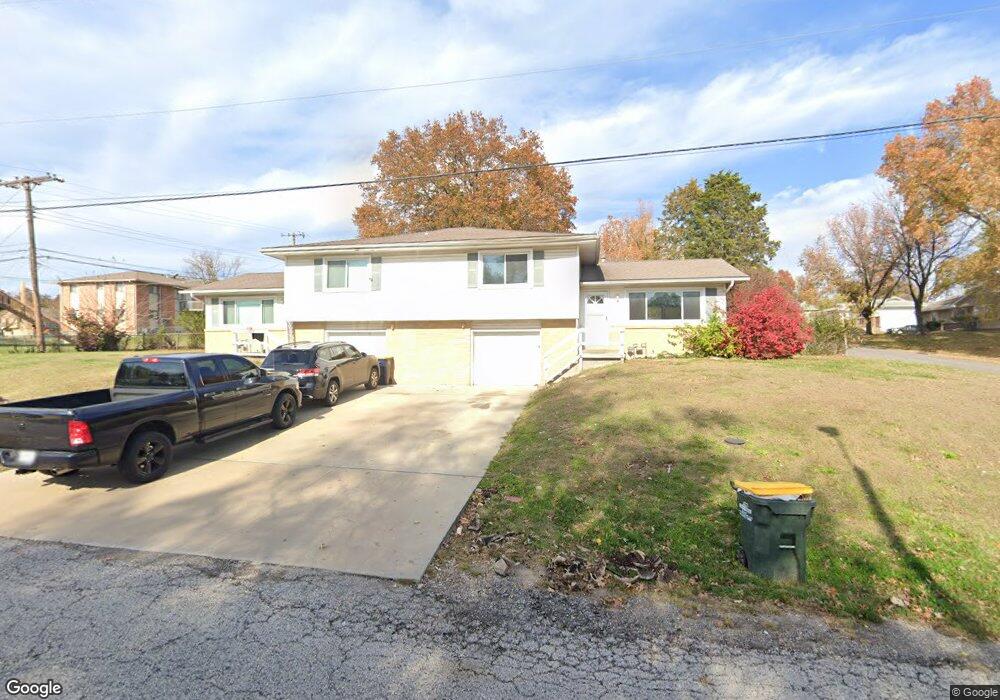
4302 NW 56th St Kansas City, MO 64151
Parkdale-Walden NeighborhoodEstimated Value: $222,000 - $381,000
5
Beds
5
Baths
2,088
Sq Ft
$146/Sq Ft
Est. Value
About This Home
This home is located at 4302 NW 56th St, Kansas City, MO 64151 and is currently estimated at $305,427, approximately $146 per square foot. 4302 NW 56th St is a home located in Platte County with nearby schools including Southeast Elementary School, Lakeview Middle School, and Plaza Middle School.
Ownership History
Date
Name
Owned For
Owner Type
Purchase Details
Closed on
Apr 7, 2020
Sold by
Mcmullin Catherine
Bought by
Horton Paul Vincent
Current Estimated Value
Home Financials for this Owner
Home Financials are based on the most recent Mortgage that was taken out on this home.
Original Mortgage
$166,500
Outstanding Balance
$147,499
Interest Rate
3.4%
Mortgage Type
New Conventional
Estimated Equity
$157,928
Purchase Details
Closed on
Jan 29, 2020
Sold by
Kansas City Re Investment Svcs Llc
Bought by
Kansas City Re Investment Svcs Llc
Home Financials for this Owner
Home Financials are based on the most recent Mortgage that was taken out on this home.
Original Mortgage
$881,500
Interest Rate
3.7%
Mortgage Type
Commercial
Purchase Details
Closed on
Sep 20, 2019
Sold by
Mabbitt Alfred and Mabbitt Carolyn K
Bought by
Kansas City Re Investment Services
Create a Home Valuation Report for This Property
The Home Valuation Report is an in-depth analysis detailing your home's value as well as a comparison with similar homes in the area
Home Values in the Area
Average Home Value in this Area
Purchase History
| Date | Buyer | Sale Price | Title Company |
|---|---|---|---|
| Horton Paul Vincent | -- | Alliance Title | |
| Horton Paul Vincent | -- | None Available | |
| Kansas City Re Investment Svcs Llc | -- | Alliance Title | |
| Kansas City Re Investment Services | -- | Alliance Title | |
| Kansas City Real Estate Investment Svcs | -- | None Available |
Source: Public Records
Mortgage History
| Date | Status | Borrower | Loan Amount |
|---|---|---|---|
| Open | Horton Paul Vincent | $166,500 | |
| Previous Owner | Kansas City Re Investment Svcs Llc | $881,500 |
Source: Public Records
Tax History Compared to Growth
Tax History
| Year | Tax Paid | Tax Assessment Tax Assessment Total Assessment is a certain percentage of the fair market value that is determined by local assessors to be the total taxable value of land and additions on the property. | Land | Improvement |
|---|---|---|---|---|
| 2024 | $3,814 | $47,637 | $3,951 | $43,686 |
| 2023 | $3,814 | $47,637 | $3,951 | $43,686 |
| 2022 | $3,649 | $44,108 | $3,951 | $40,157 |
| 2021 | $3,661 | $44,108 | $3,951 | $40,157 |
| 2020 | $2,689 | $32,578 | $3,230 | $29,348 |
| 2019 | $2,689 | $32,578 | $3,230 | $29,348 |
| 2018 | $2,739 | $32,578 | $3,230 | $29,348 |
| 2017 | $2,716 | $32,578 | $3,230 | $29,348 |
| 2016 | $2,732 | $32,578 | $3,230 | $29,348 |
| 2015 | $2,740 | $32,578 | $3,230 | $29,348 |
| 2013 | $2,689 | $32,578 | $0 | $0 |
Source: Public Records
Map
Nearby Homes
- 5761 N Anita Ave
- 5549 NW Adrian Ave
- 5726 N Anita Ave
- 5417 NW Hillside Dr
- 5708 N Oregon Ave
- 5743 N London Ave
- 5237 N Merrimac Ave
- 3701 NW 56th St
- 5768 N Anita Ave
- 5770 N Anita Ave
- 4512 NW 58th Terrace
- 5729 N Oregon Ave
- 5817 N Lenox Ave
- 4509 NW 50th Terrace
- 5018 NW Huonker Rd
- 4860 NW Huonker Rd
- 4815 NW Huonker Rd
- 4850 NW Huonker Rd
- 5003 NW High Drive Terrace
- 4825 NW Martin Dr
- 4304 NW 56th St
- 5602 N Strathbury Ave Unit 5604
- 5604 N Strathbury Ave
- 4305 NW 56th St
- 4305 NW 56th St Unit ID1328905P
- 5601 N Strathbury Ave Unit 5603
- 5606 N Strathbury Ave
- 5605 N Strathbury Ave
- 5609 N Strathbury Ave
- 5610 N Strathbury Ave
- 5604 NW Hillside Dr
- 5602 NW Hillside Dr
- 5606 NW Hillside Dr Unit 5608
- 5606-5608 NW Hillside Dr
- 5613 N Strathbury Ave Unit 5615
- 4225 NW 56th St
- 5614 N Strathbury Ave
- 5614 N Strathbury Ave
- 5610 NW Hillside Dr
- 5616 N Strathbury Ave