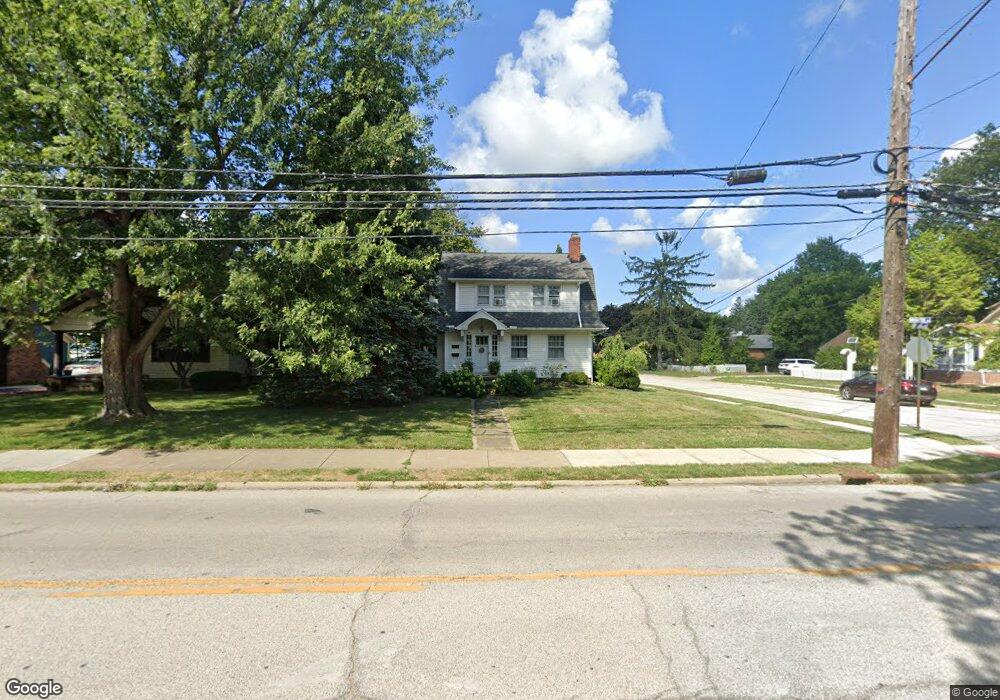
4304 Wooster Rd Cleveland, OH 44126
Estimated Value: $304,000 - $389,000
3
Beds
1
Bath
1,604
Sq Ft
$210/Sq Ft
Est. Value
About This Home
This home is located at 4304 Wooster Rd, Cleveland, OH 44126 and is currently estimated at $337,034, approximately $210 per square foot. 4304 Wooster Rd is a home located in Cuyahoga County with nearby schools including Gilles-Sweet Elementary School, Lewis F Mayer Middle School, and Fairview High School.
Ownership History
Date
Name
Owned For
Owner Type
Purchase Details
Closed on
Aug 26, 2016
Sold by
Boland Daniel M
Bought by
Boland Daniel M
Current Estimated Value
Home Financials for this Owner
Home Financials are based on the most recent Mortgage that was taken out on this home.
Original Mortgage
$153,163
Outstanding Balance
$107,952
Interest Rate
3.94%
Mortgage Type
FHA
Estimated Equity
$229,082
Purchase Details
Closed on
Aug 5, 2008
Sold by
Kavula William S and Martens Brenda S
Bought by
Boland Daniel M
Home Financials for this Owner
Home Financials are based on the most recent Mortgage that was taken out on this home.
Original Mortgage
$169,083
Interest Rate
6.51%
Mortgage Type
FHA
Purchase Details
Closed on
Jan 20, 1993
Sold by
Dreher Joseph M
Bought by
Kavula William S
Purchase Details
Closed on
Mar 4, 1988
Sold by
Ekey Lawrence E
Bought by
Dreher Joseph M
Purchase Details
Closed on
Jan 1, 1975
Bought by
Ekey Lawrence E
Create a Home Valuation Report for This Property
The Home Valuation Report is an in-depth analysis detailing your home's value as well as a comparison with similar homes in the area
Home Values in the Area
Average Home Value in this Area
Purchase History
| Date | Buyer | Sale Price | Title Company |
|---|---|---|---|
| Boland Daniel M | -- | None Available | |
| Boland Daniel M | $170,000 | Truetitle Agency Inc | |
| Kavula William S | $125,000 | -- | |
| Dreher Joseph M | $92,900 | -- | |
| Ekey Lawrence E | -- | -- |
Source: Public Records
Mortgage History
| Date | Status | Borrower | Loan Amount |
|---|---|---|---|
| Open | Boland Daniel M | $153,163 | |
| Closed | Boland Daniel M | $169,083 |
Source: Public Records
Tax History Compared to Growth
Tax History
| Year | Tax Paid | Tax Assessment Tax Assessment Total Assessment is a certain percentage of the fair market value that is determined by local assessors to be the total taxable value of land and additions on the property. | Land | Improvement |
|---|---|---|---|---|
| 2024 | $6,490 | $94,465 | $25,865 | $68,600 |
| 2023 | $6,708 | $83,870 | $20,480 | $63,390 |
| 2022 | $6,542 | $83,860 | $20,480 | $63,390 |
| 2021 | $6,692 | $83,860 | $20,480 | $63,390 |
| 2020 | $6,511 | $71,680 | $17,500 | $54,180 |
| 2019 | $5,784 | $204,800 | $50,000 | $154,800 |
| 2018 | $5,643 | $71,680 | $17,500 | $54,180 |
| 2017 | $5,767 | $66,090 | $12,990 | $53,100 |
| 2016 | $5,728 | $66,090 | $12,990 | $53,100 |
| 2015 | $5,490 | $66,090 | $12,990 | $53,100 |
| 2014 | $4,946 | $57,480 | $11,310 | $46,170 |
Source: Public Records
Map
Nearby Homes
- 19640 Lorain Rd
- 4336 W 196th St
- 4348 W 202nd St
- 19510 Lorain Rd Unit 201
- 20187 Grannis Rd
- 19575 Henry Rd
- 19270 Lorain Rd
- 19190 S Sagamore Rd
- 20663 Woodstock Ave
- 20778 Woodstock Ave
- 3457 Wooster Rd
- 18875 Riversouth Terrace Unit 27
- 3400 Wooster Rd Unit 401
- 3400 Wooster Rd Unit 622
- 3400 Wooster Rd Unit 412
- 3400 Wooster Rd Unit 301
- 18875 Riversouth Trace Unit 30
- 3394 Wooster Rd
- 3167 Linden Rd Unit 503
- 3167 Linden Rd Unit 309
- 4318 Wooster Rd
- 4278 Wooster Rd
- 4328 Wooster Rd
- 19981 Speidel Ave
- 4344 Wooster Rd
- 20011 Speidel Ave
- 19980 Speidel Ave
- 4350 Wooster Rd
- 20010 Speidel Ave
- 4254 Wooster Rd
- 4289 Wooster Rd
- 20021 Speidel Ave
- 4325 Wooster Rd
- 4277 Wooster Rd
- 20020 Speidel Ave
- 4354 Wooster Rd
- 20031 Speidel Ave
- 4261 Wooster Rd
- 20030 Speidel Ave
- 20041 Speidel Ave