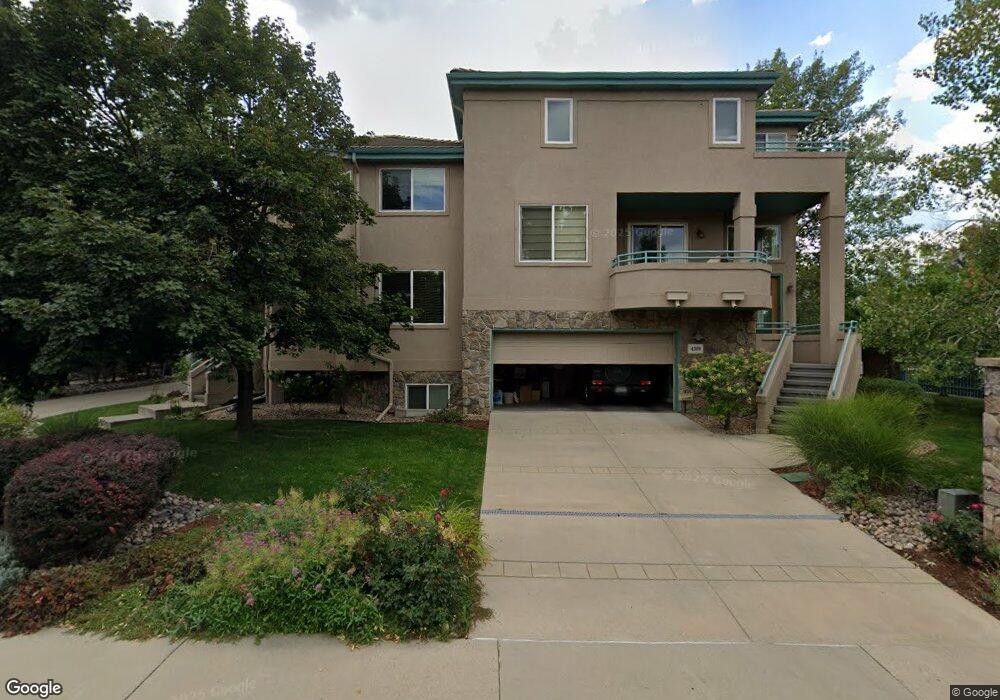
4308 Clay Commons Ct Unit A Boulder, CO 80303
East Aurora NeighborhoodEstimated Value: $805,000 - $929,000
3
Beds
4
Baths
2,305
Sq Ft
$382/Sq Ft
Est. Value
About This Home
This home is located at 4308 Clay Commons Ct Unit A, Boulder, CO 80303 and is currently estimated at $881,222, approximately $382 per square foot. 4308 Clay Commons Ct Unit A is a home located in Boulder County with nearby schools including Creekside Elementary School, Manhattan Middle School of the Arts & Academics, and Fairview High School.
Ownership History
Date
Name
Owned For
Owner Type
Purchase Details
Closed on
Nov 3, 2021
Sold by
Ziervogel Robert G and Ziervogel Cindy G
Bought by
Sparkman Roy D
Current Estimated Value
Purchase Details
Closed on
Aug 24, 2012
Sold by
Jennings Ellen J
Bought by
Ziervogel Robert G
Home Financials for this Owner
Home Financials are based on the most recent Mortgage that was taken out on this home.
Original Mortgage
$375,000
Interest Rate
3.57%
Mortgage Type
New Conventional
Purchase Details
Closed on
Feb 19, 2008
Sold by
Miller Linda Lee and Miller Randy N
Bought by
Jennings Ellen L
Home Financials for this Owner
Home Financials are based on the most recent Mortgage that was taken out on this home.
Original Mortgage
$417,000
Interest Rate
5.47%
Mortgage Type
Purchase Money Mortgage
Purchase Details
Closed on
Sep 13, 2002
Sold by
I T S Construction Inc
Bought by
Miller Randy N
Home Financials for this Owner
Home Financials are based on the most recent Mortgage that was taken out on this home.
Original Mortgage
$448,180
Interest Rate
6.41%
Create a Home Valuation Report for This Property
The Home Valuation Report is an in-depth analysis detailing your home's value as well as a comparison with similar homes in the area
Home Values in the Area
Average Home Value in this Area
Purchase History
| Date | Buyer | Sale Price | Title Company |
|---|---|---|---|
| Sparkman Roy D | $902,500 | Land Title Guarantee Co | |
| Ziervogel Robert G | $575,000 | Fidelity National Title Insu | |
| Jennings Ellen L | $645,000 | Fahtco | |
| Miller Randy N | $566,890 | -- |
Source: Public Records
Mortgage History
| Date | Status | Borrower | Loan Amount |
|---|---|---|---|
| Previous Owner | Ziervogel Robert G | $375,000 | |
| Previous Owner | Jennings Ellen L | $417,000 | |
| Previous Owner | Miller Randy N | $448,180 |
Source: Public Records
Tax History
| Year | Tax Paid | Tax Assessment Tax Assessment Total Assessment is a certain percentage of the fair market value that is determined by local assessors to be the total taxable value of land and additions on the property. | Land | Improvement |
|---|---|---|---|---|
| 2025 | $5,698 | $66,125 | -- | $66,125 |
| 2024 | $5,698 | $66,125 | -- | $66,125 |
| 2023 | $5,600 | $64,840 | -- | $68,525 |
| 2022 | $4,891 | $52,667 | $0 | $52,667 |
| 2021 | $4,664 | $54,183 | $0 | $54,183 |
| 2020 | $4,823 | $55,413 | $0 | $55,413 |
| 2019 | $4,750 | $55,413 | $0 | $55,413 |
| 2018 | $4,812 | $55,498 | $0 | $55,498 |
| 2017 | $4,661 | $61,356 | $0 | $61,356 |
| 2016 | $4,169 | $48,158 | $0 | $48,158 |
| 2015 | $3,948 | $42,896 | $0 | $42,896 |
| 2014 | $3,607 | $42,896 | $0 | $42,896 |
Source: Public Records
Map
Nearby Homes
- 4415 Laguna Place Unit 201
- 4500 Baseline Rd Unit 1204
- 4475 Laguna Place Unit 206
- 4475 Laguna Place Unit 201
- 4281 Eaton Ct
- 875 Orman Dr
- 4195 Chippewa Dr
- 790 Morgan Dr
- 4222 Monroe Dr Unit C
- 500 Mohawk Dr Unit 309
- 540 Mohawk Dr Unit 18
- 770 36th St
- 1180 Monroe Dr Unit B
- 905 36th St
- 695 Manhattan Dr Unit 109
- 695 Manhattan Dr Unit 116
- 885 35th St
- 625 Manhattan Place Unit 308
- 780 33rd St
- 665 Manhattan Dr Unit 9
- 4308 Clay Commons Ct Unit 4308
- 4310 Clay Commons Ct Unit 4310
- 4310 Clay Commons Ct Unit B
- 4312 Clay Commons Ct Unit 4312
- 4312 Clay Commons Ct Unit B
- 710 Inca Pkwy Unit A
- 4324 Clay Commons Ct Unit 4324
- 4322 Clay Commons Ct Unit 4322
- 4309 Clay Commons Ct Unit 4309
- 760 Inca Pkwy Unit 760
- 4309 Clay Commons Ct Unit B
- 725 Inca Pkwy
- 705 Inca Pkwy
- 4335 Clay Commons Ct Unit 4335
- 755 Inca Pkwy
- 4334 Clay Commons Ct Unit 4334
- 4321 Clay Commons Ct Unit 4321
- 4321 Clay Commons Ct Unit A
- 4311 Clay Commons Ct Unit 4311
- 4311 Clay Commons Ct Unit B
Your Personal Tour Guide
Ask me questions while you tour the home.