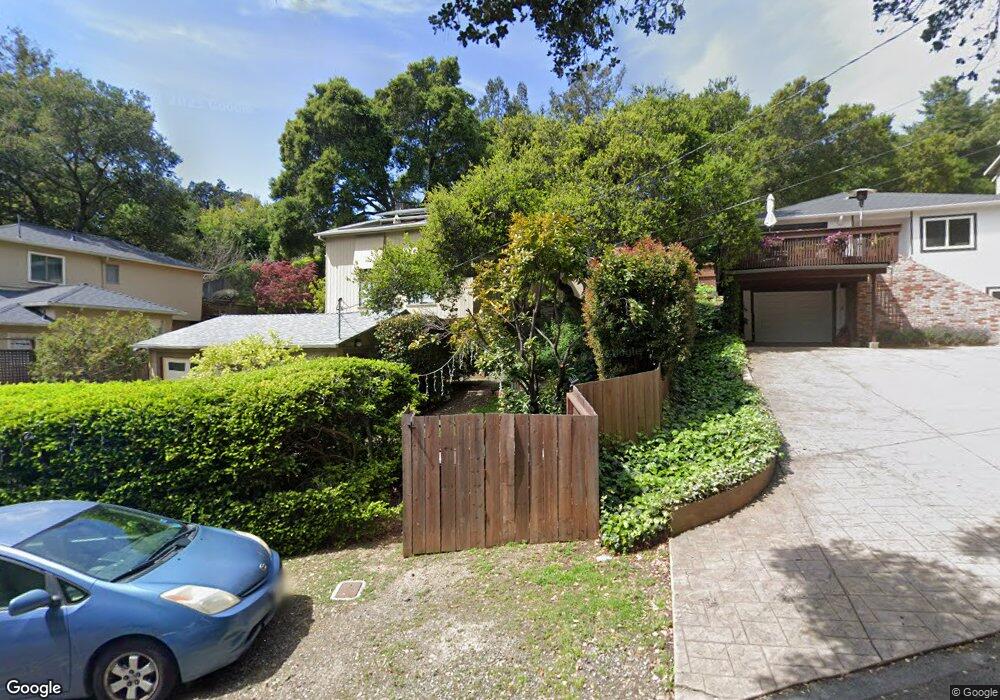
4309 Whittle Ave Oakland, CA 94602
Oakmore NeighborhoodEstimated Value: $1,248,000 - $1,376,000
3
Beds
2
Baths
2,101
Sq Ft
$635/Sq Ft
Est. Value
About This Home
This home is located at 4309 Whittle Ave, Oakland, CA 94602 and is currently estimated at $1,334,654, approximately $635 per square foot. 4309 Whittle Ave is a home located in Alameda County with nearby schools including Joaquin Miller Elementary School, Bret Harte Middle School, and Skyline High School.
Ownership History
Date
Name
Owned For
Owner Type
Purchase Details
Closed on
May 10, 2005
Sold by
Caulfield Timothy O and The Timothy Caulfield Living T
Bought by
Brakeman Paul and Brakeman Jennifer
Current Estimated Value
Home Financials for this Owner
Home Financials are based on the most recent Mortgage that was taken out on this home.
Original Mortgage
$650,000
Outstanding Balance
$338,914
Interest Rate
5.84%
Mortgage Type
Fannie Mae Freddie Mac
Estimated Equity
$995,740
Purchase Details
Closed on
Mar 26, 1997
Sold by
Morse Linda F
Bought by
Morse Linda F and Linda Morse Living Trust
Purchase Details
Closed on
Sep 5, 1996
Sold by
Caulfield Timothy O and Morse Linda F
Bought by
Caulfield Timothy O and Morse Linda F
Home Financials for this Owner
Home Financials are based on the most recent Mortgage that was taken out on this home.
Original Mortgage
$50,000
Interest Rate
8.23%
Purchase Details
Closed on
Feb 12, 1996
Sold by
Caulfield Timothy O
Bought by
Caulfield Timothy O
Create a Home Valuation Report for This Property
The Home Valuation Report is an in-depth analysis detailing your home's value as well as a comparison with similar homes in the area
Home Values in the Area
Average Home Value in this Area
Purchase History
| Date | Buyer | Sale Price | Title Company |
|---|---|---|---|
| Brakeman Paul | $820,000 | Old Republic Title Company | |
| Morse Linda F | -- | -- | |
| Caulfield Timothy O | -- | Fidelity National Title Co | |
| Caulfield Timothy O | -- | Fidelity National Title Ins | |
| Caulfield Timothy O | -- | -- |
Source: Public Records
Mortgage History
| Date | Status | Borrower | Loan Amount |
|---|---|---|---|
| Open | Brakeman Paul | $650,000 | |
| Previous Owner | Caulfield Timothy O | $50,000 |
Source: Public Records
Tax History Compared to Growth
Tax History
| Year | Tax Paid | Tax Assessment Tax Assessment Total Assessment is a certain percentage of the fair market value that is determined by local assessors to be the total taxable value of land and additions on the property. | Land | Improvement |
|---|---|---|---|---|
| 2025 | $16,269 | $1,135,898 | $342,869 | $800,029 |
| 2024 | $16,269 | $1,113,497 | $336,149 | $784,348 |
| 2023 | $17,133 | $1,098,528 | $329,558 | $768,970 |
| 2022 | $16,733 | $1,069,995 | $323,098 | $753,897 |
| 2021 | $16,147 | $1,048,880 | $316,764 | $739,116 |
| 2020 | $15,964 | $1,045,057 | $313,517 | $731,540 |
| 2019 | $15,457 | $1,024,573 | $307,372 | $717,201 |
| 2018 | $15,119 | $1,004,491 | $301,347 | $703,144 |
| 2017 | $14,574 | $984,803 | $295,441 | $689,362 |
| 2016 | $14,178 | $965,500 | $289,650 | $675,850 |
Source: Public Records
Map
Nearby Homes
- 4271 Whittle Ave
- 1975 Wrenn St
- 4445 Arcadia Ave
- 1989 Oakview Dr
- 4224 Lincoln Ave
- 2093 Braemar Rd
- 1942 Leimert Blvd
- 1842 Brentwood Rd
- 2436 Potomac St
- 4751 Lincoln Ave
- 2471 Burlington St
- 37 Coolidge Terrace
- 4019 Rhoda Ave
- 4081 Waterhouse Rd
- 180 Maiden Ln
- 2818 Steinmetz Way
- 2510 Delmer St
- 3887 Forest Hill Ave
- 5040 Pierpoint Ave
- 4301 Whittle Ave
- 4315 Whittle Ave
- 4293 Whittle Ave
- 4323 Whittle Ave
- 4285 Whittle Ave
- 4300 Fruitvale Ave
- 4337 Whittle Ave
- 4288 Fruitvale Ave
- 4314 Whittle Ave
- 4300 Whittle Ave
- 4282 Fruitvale Ave
- 4276 Fruitvale Ave
- 4336 Whittle Ave
- 4336 Whittle Ave
- 4324 Whittle Ave
- 4277 Whittle Ave
- 2168 Wrenn St
- 4343 Whittle Ave
- 4316 Fruitvale Ave
- 4332 Fruitvale Ave