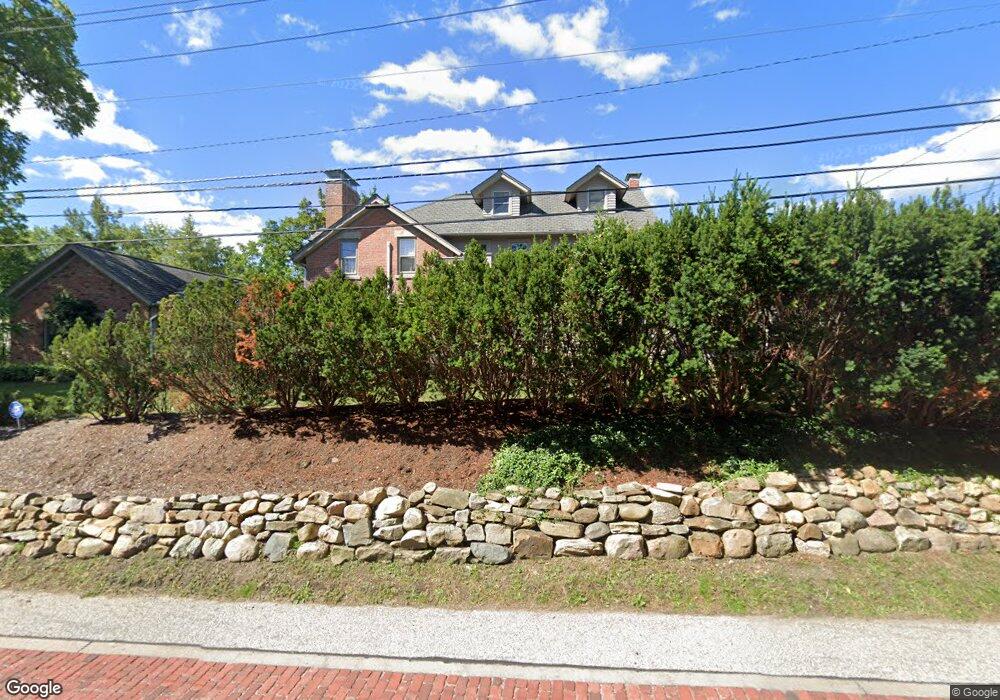
431 Falls Rd Chagrin Falls, OH 44022
Estimated Value: $923,826 - $1,337,000
6
Beds
5
Baths
4,076
Sq Ft
$256/Sq Ft
Est. Value
About This Home
This home is located at 431 Falls Rd, Chagrin Falls, OH 44022 and is currently estimated at $1,042,957, approximately $255 per square foot. 431 Falls Rd is a home located in Cuyahoga County with nearby schools including Gurney Elementary School, Chagrin Falls Intermediate Elementary School, and Chagrin Falls Middle School.
Ownership History
Date
Name
Owned For
Owner Type
Purchase Details
Closed on
May 28, 2003
Sold by
Moy Philip J and Moy Ann M
Bought by
Alusheff Charles P and Morrow Alusheff Donna
Current Estimated Value
Home Financials for this Owner
Home Financials are based on the most recent Mortgage that was taken out on this home.
Original Mortgage
$512,000
Outstanding Balance
$226,232
Interest Rate
5.9%
Mortgage Type
Purchase Money Mortgage
Estimated Equity
$816,725
Purchase Details
Closed on
Jun 5, 1998
Sold by
Cornell Marilyn C
Bought by
Moy Philip J and Moy Ann M
Home Financials for this Owner
Home Financials are based on the most recent Mortgage that was taken out on this home.
Original Mortgage
$305,000
Interest Rate
7.32%
Purchase Details
Closed on
Aug 14, 1987
Sold by
Anderson Jack C
Bought by
Cornell Marilyn C
Purchase Details
Closed on
Nov 2, 1982
Sold by
Irmscher Michele D and W G
Bought by
Anderson Jack C
Purchase Details
Closed on
Jan 1, 1981
Bought by
Irmscher Michele D and W G
Create a Home Valuation Report for This Property
The Home Valuation Report is an in-depth analysis detailing your home's value as well as a comparison with similar homes in the area
Home Values in the Area
Average Home Value in this Area
Purchase History
| Date | Buyer | Sale Price | Title Company |
|---|---|---|---|
| Alusheff Charles P | $640,000 | Midland Title Security Inc | |
| Moy Philip J | $565,000 | -- | |
| Cornell Marilyn C | $227,500 | -- | |
| Anderson Jack C | $170,000 | -- | |
| Irmscher Michele D | -- | -- |
Source: Public Records
Mortgage History
| Date | Status | Borrower | Loan Amount |
|---|---|---|---|
| Open | Alusheff Charles P | $512,000 | |
| Closed | Moy Philip J | $305,000 | |
| Closed | Moy Philip J | $125,000 |
Source: Public Records
Tax History
| Year | Tax Paid | Tax Assessment Tax Assessment Total Assessment is a certain percentage of the fair market value that is determined by local assessors to be the total taxable value of land and additions on the property. | Land | Improvement |
|---|---|---|---|---|
| 2024 | $19,712 | $319,690 | $43,470 | $276,220 |
| 2023 | $19,560 | $274,610 | $54,530 | $220,080 |
| 2022 | $20,690 | $289,070 | $54,530 | $234,540 |
| 2021 | $21,685 | $289,070 | $54,530 | $234,540 |
| 2020 | $18,796 | $231,250 | $43,610 | $187,640 |
| 2019 | $18,514 | $660,700 | $124,600 | $536,100 |
| 2018 | $17,613 | $231,250 | $43,610 | $187,640 |
| 2017 | $18,698 | $222,290 | $25,970 | $196,320 |
| 2016 | $16,788 | $222,290 | $25,970 | $196,320 |
| 2015 | $25,568 | $222,290 | $25,970 | $196,320 |
| 2014 | $25,568 | $222,290 | $25,970 | $196,320 |
Source: Public Records
Map
Nearby Homes
- 117 E Cottage St
- 190 Columbus St
- 117 Cleveland St
- 110 Emilia Ct
- 270 Chagrin Blvd
- 106 W Washington St
- 7059 Deepwood Dr
- 81 Hall St
- 156 S Franklin St
- 35 Hopewell Trail
- 207 S Main St
- 213 S Main St
- 219 S Main St
- 40 Highland Ln
- 225 S Main St
- 7650 Blackford Dr
- 15813 Hemlock Rd
- 7658 Blackford Dr
- 7771 Blackford Dr
- 318 Hillside Ln
Your Personal Tour Guide
Ask me questions while you tour the home.