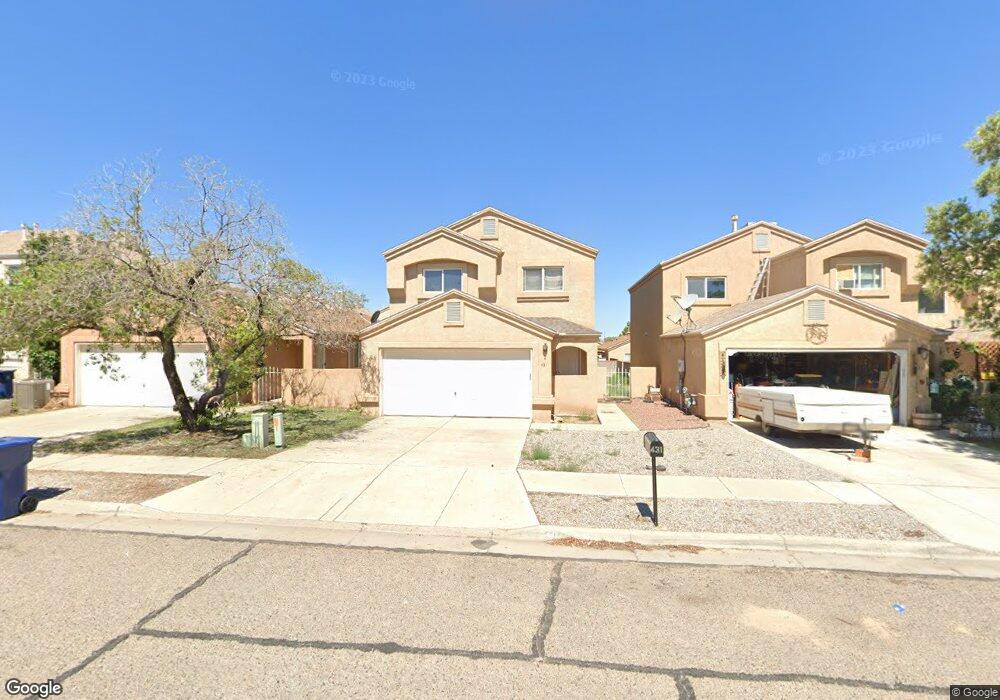
431 Little Wings Loop SW Los Lunas, NM 87031
Estimated Value: $269,000 - $299,240
4
Beds
3
Baths
1,582
Sq Ft
$181/Sq Ft
Est. Value
About This Home
This home is located at 431 Little Wings Loop SW, Los Lunas, NM 87031 and is currently estimated at $286,060, approximately $180 per square foot. 431 Little Wings Loop SW is a home located in Valencia County with nearby schools including Katherine Gallegos Elementary School, Los Lunas Middle School, and Los Lunas High School.
Ownership History
Date
Name
Owned For
Owner Type
Purchase Details
Closed on
Jun 25, 2007
Sold by
Newman Craig W and Castillo Theresa M
Bought by
Orr Kayla J
Current Estimated Value
Home Financials for this Owner
Home Financials are based on the most recent Mortgage that was taken out on this home.
Original Mortgage
$153,500
Outstanding Balance
$93,926
Interest Rate
6.19%
Mortgage Type
New Conventional
Estimated Equity
$192,134
Purchase Details
Closed on
Feb 8, 2006
Sold by
Sears Robert D and Sears Jennifer L
Bought by
Newman Craig W and Castillo Theresa
Home Financials for this Owner
Home Financials are based on the most recent Mortgage that was taken out on this home.
Original Mortgage
$130,500
Interest Rate
3.5%
Mortgage Type
Adjustable Rate Mortgage/ARM
Purchase Details
Closed on
Jan 12, 2005
Sold by
Sears Jennifer L
Bought by
Sears Robert D and Sears Jennifer L
Create a Home Valuation Report for This Property
The Home Valuation Report is an in-depth analysis detailing your home's value as well as a comparison with similar homes in the area
Home Values in the Area
Average Home Value in this Area
Purchase History
| Date | Buyer | Sale Price | Title Company |
|---|---|---|---|
| Orr Kayla J | -- | Fidelity National Title Isnu | |
| Newman Craig W | -- | Rio Grande Title Co | |
| Sears Robert D | -- | Stewart Title |
Source: Public Records
Mortgage History
| Date | Status | Borrower | Loan Amount |
|---|---|---|---|
| Open | Orr Kayla J | $153,500 | |
| Previous Owner | Newman Craig W | $130,500 |
Source: Public Records
Tax History Compared to Growth
Tax History
| Year | Tax Paid | Tax Assessment Tax Assessment Total Assessment is a certain percentage of the fair market value that is determined by local assessors to be the total taxable value of land and additions on the property. | Land | Improvement |
|---|---|---|---|---|
| 2024 | $2,408 | $72,739 | $11,860 | $60,879 |
| 2023 | $2,323 | $70,621 | $11,720 | $58,901 |
| 2022 | $2,285 | $68,564 | $11,583 | $56,981 |
| 2021 | $2,239 | $66,567 | $11,930 | $54,637 |
| 2020 | $2,216 | $64,629 | $11,583 | $53,046 |
| 2019 | $2,228 | $64,629 | $11,583 | $53,046 |
| 2018 | $2,178 | $64,304 | $11,583 | $52,721 |
| 2017 | $2,082 | $62,432 | $11,583 | $50,849 |
| 2016 | $2,025 | $60,613 | $11,583 | $49,030 |
| 2015 | -- | $58,848 | $11,583 | $47,265 |
| 2013 | -- | $55,470 | $11,583 | $43,887 |
| 2011 | -- | $161,565 | $33,738 | $127,827 |
Source: Public Records
Map
Nearby Homes
- 1628 Drake Rd
- 00 New Mexico 6
- 0 Drake Rd
- 0 Main Grant
- 1034 Wagon Trail St
- 1050 Wagon Trail St SW
- 823 Corral St SW
- 2260 Firewheel Ave SW
- 2258 Calle de Ortiz SW
- 2601 Scarlet Sage Rd SW
- 2512 Red Sky SW
- 2260 Calle de Alifas SW
- 1107 Valley View Dr SW
- 981 Canal Blvd SW
- 660 Primrose Ave SW
- 0 Nwc of Palmilla and Desert Wil
- 960 Firewheel Loop SW
- 711 Firewheel Loop SW
- 2670 Scarlet Sage St SW
- 750 Fire Wheel Loop
- 435 Little Wings Loop SW
- 421 Little Wings Loop SW
- 411 Little Wings Loop SW
- 441 Little Wings Loop SW
- 651 Little Wings Loop SW
- 641 Little Wings Loop SW
- 661 Little Wings Loop SW
- 451 Little Wings Loop SW
- 401 Little Wings Loop SW
- 631 Little Wings Loop SW
- 671 Little Wings Loop SW
- 420 Little Wings Loop SW
- 430 Little Wings Loop SW
- 621 Little Wings Loop SW
- 461 Little Wings Loop SW
- 410 Little Wings Loop SW
- 681 Little Wings Loop SW
- 440 Little Wings Loop SW
- 611 Little Wings Loop SW
- 400 Little Wings Loop SW