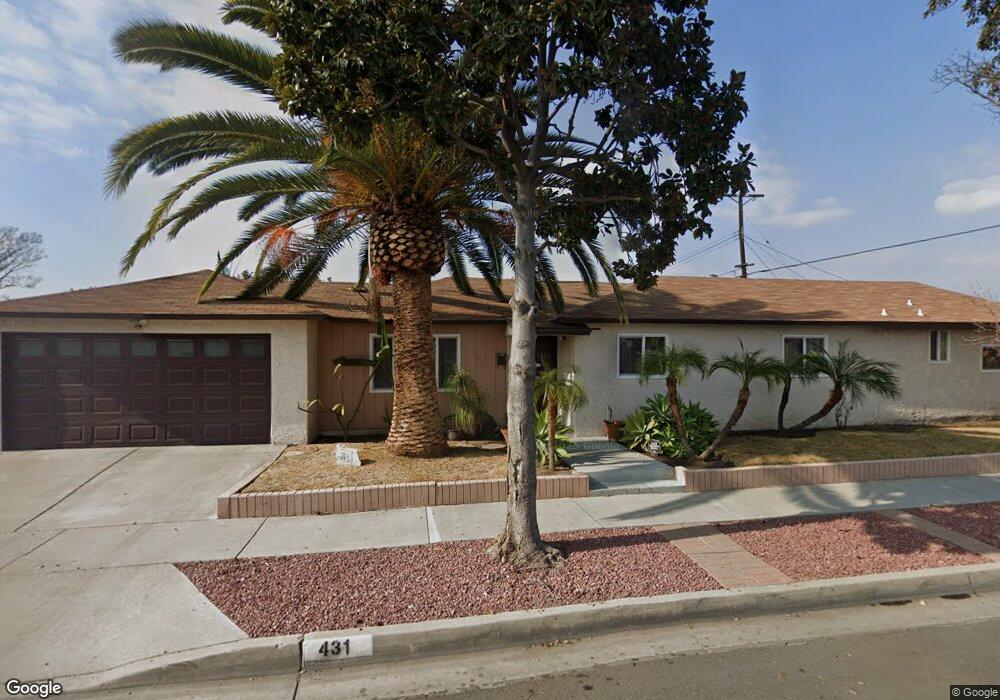
431 Mayland Ave La Puente, CA 91746
Estimated Value: $818,000 - $846,481
4
Beds
4
Baths
2,122
Sq Ft
$391/Sq Ft
Est. Value
About This Home
This home is located at 431 Mayland Ave, La Puente, CA 91746 and is currently estimated at $830,120, approximately $391 per square foot. 431 Mayland Ave is a home located in Los Angeles County with nearby schools including Sunkist Elementary School, Torch Middle School, and Bassett Senior High School.
Ownership History
Date
Name
Owned For
Owner Type
Purchase Details
Closed on
Oct 12, 2005
Sold by
Barillas Victor
Bought by
Almeida Peter R
Current Estimated Value
Home Financials for this Owner
Home Financials are based on the most recent Mortgage that was taken out on this home.
Original Mortgage
$300,000
Outstanding Balance
$116,197
Interest Rate
1.5%
Mortgage Type
Negative Amortization
Estimated Equity
$713,923
Purchase Details
Closed on
Jun 17, 2003
Sold by
Almeida Peter Robert and Almeida Wyllie
Bought by
Almeida Peter R
Home Financials for this Owner
Home Financials are based on the most recent Mortgage that was taken out on this home.
Original Mortgage
$167,475
Interest Rate
5.37%
Mortgage Type
FHA
Purchase Details
Closed on
Aug 24, 1993
Sold by
Almeida Lucita and Almeida Peter Robert
Bought by
Almeida Peter Robert
Home Financials for this Owner
Home Financials are based on the most recent Mortgage that was taken out on this home.
Original Mortgage
$122,000
Interest Rate
6.98%
Create a Home Valuation Report for This Property
The Home Valuation Report is an in-depth analysis detailing your home's value as well as a comparison with similar homes in the area
Home Values in the Area
Average Home Value in this Area
Purchase History
| Date | Buyer | Sale Price | Title Company |
|---|---|---|---|
| Almeida Peter R | -- | Nct | |
| Almeida Peter R | -- | Ticor Title Company | |
| Almeida Peter Robert | -- | First American Title Company |
Source: Public Records
Mortgage History
| Date | Status | Borrower | Loan Amount |
|---|---|---|---|
| Open | Almeida Peter R | $300,000 | |
| Previous Owner | Almeida Peter R | $167,475 | |
| Previous Owner | Almeida Peter Robert | $122,000 |
Source: Public Records
Tax History Compared to Growth
Tax History
| Year | Tax Paid | Tax Assessment Tax Assessment Total Assessment is a certain percentage of the fair market value that is determined by local assessors to be the total taxable value of land and additions on the property. | Land | Improvement |
|---|---|---|---|---|
| 2025 | $6,523 | $490,281 | $248,225 | $242,056 |
| 2024 | $6,523 | $480,668 | $243,358 | $237,310 |
| 2023 | $6,329 | $471,244 | $238,587 | $232,657 |
| 2022 | $6,058 | $462,005 | $233,909 | $228,096 |
| 2021 | $5,946 | $452,947 | $229,323 | $223,624 |
| 2019 | $5,798 | $439,515 | $222,522 | $216,993 |
| 2018 | $4,938 | $378,266 | $218,159 | $160,107 |
| 2016 | $4,741 | $363,580 | $209,689 | $153,891 |
| 2015 | $4,626 | $358,120 | $206,540 | $151,580 |
| 2014 | $4,403 | $351,106 | $202,495 | $148,611 |
Source: Public Records
Map
Nearby Homes
- 13903 Moccasin St
- 13622 Hartsville St
- 335 Willow Ave
- 452 Willow Ave
- 610 Willow Ave
- 13426 Austen Way
- 433 Sunkist Ave
- 720 Le Borgne Ave
- 227 S 4th Ave
- 13540 Valley Blvd
- 544 N Orange Ave Unit B
- 208 S 2nd Ave
- 915 Stichman Ave
- 979 Willow Ave Unit 31
- 943 Willow Ave
- 338 S 4th Ave
- 1003 Le Borgne Ave
- 320 S 5th Ave
- 736 Tonopah Ave
- 14421 Flynn St
- 13739 Moccasin St
- 13744 Prichard St
- 13738 Prichard St
- 13733 Moccasin St
- 415 Mayland Ave
- 13732 Prichard St
- 432 Mayland Ave
- 13738 Moccasin St
- 426 Mayland Ave
- 440 Mayland Ave
- 13727 Moccasin St
- 420 Mayland Ave
- 13732 Moccasin St
- 13726 Prichard St
- 446 Mayland Ave
- 416 Mayland Ave
- 13726 Moccasin St
- 13721 Moccasin St
- 13741 Prichard St
- 455 Mayland Ave