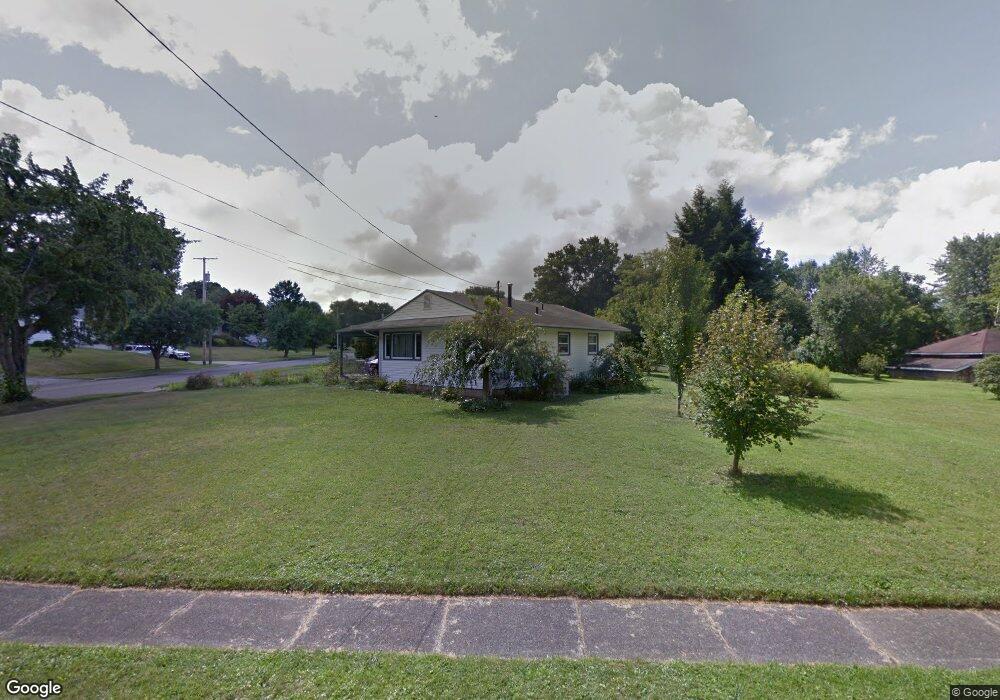
431 Moore St Hubbard, OH 44425
Estimated Value: $149,000 - $183,565
3
Beds
2
Baths
1,376
Sq Ft
$120/Sq Ft
Est. Value
About This Home
This home is located at 431 Moore St, Hubbard, OH 44425 and is currently estimated at $165,641, approximately $120 per square foot. 431 Moore St is a home located in Trumbull County with nearby schools including Hubbard Elementary School, Hubbard Middle School, and Hubbard High School.
Ownership History
Date
Name
Owned For
Owner Type
Purchase Details
Closed on
Feb 19, 2013
Sold by
Poma Denice C and Poma Eric B
Bought by
Poma Eric B and Poma Heather K
Current Estimated Value
Home Financials for this Owner
Home Financials are based on the most recent Mortgage that was taken out on this home.
Original Mortgage
$57,500
Outstanding Balance
$10,917
Interest Rate
2.72%
Mortgage Type
New Conventional
Estimated Equity
$154,724
Purchase Details
Closed on
Jul 11, 2008
Sold by
Poma Denice
Bought by
Poma Denice C and Poma Eric B
Purchase Details
Closed on
Jan 1, 1990
Bought by
Trust
Create a Home Valuation Report for This Property
The Home Valuation Report is an in-depth analysis detailing your home's value as well as a comparison with similar homes in the area
Home Values in the Area
Average Home Value in this Area
Purchase History
| Date | Buyer | Sale Price | Title Company |
|---|---|---|---|
| Poma Eric B | $56,900 | None Available | |
| Poma Denice C | -- | Attorney | |
| Trust | -- | -- |
Source: Public Records
Mortgage History
| Date | Status | Borrower | Loan Amount |
|---|---|---|---|
| Open | Poma Eric B | $57,500 |
Source: Public Records
Tax History Compared to Growth
Tax History
| Year | Tax Paid | Tax Assessment Tax Assessment Total Assessment is a certain percentage of the fair market value that is determined by local assessors to be the total taxable value of land and additions on the property. | Land | Improvement |
|---|---|---|---|---|
| 2024 | $2,456 | $50,300 | $7,350 | $42,950 |
| 2023 | $2,456 | $50,300 | $7,350 | $42,950 |
| 2022 | $1,775 | $33,150 | $6,620 | $26,530 |
| 2021 | $1,783 | $33,150 | $6,620 | $26,530 |
| 2020 | $1,792 | $33,150 | $6,620 | $26,530 |
| 2019 | $1,698 | $30,110 | $6,620 | $23,490 |
| 2018 | $1,692 | $30,110 | $6,620 | $23,490 |
| 2017 | $1,688 | $30,110 | $6,620 | $23,490 |
| 2016 | $1,511 | $28,670 | $6,620 | $22,050 |
| 2015 | $1,517 | $28,670 | $6,620 | $22,050 |
| 2014 | $1,482 | $28,670 | $6,620 | $22,050 |
| 2013 | $1,479 | $28,670 | $6,620 | $22,050 |
Source: Public Records
Map
Nearby Homes
- 395 Elizabeth St
- 611 Moore St
- 430 E Park Ave
- 462 Elizabeth St
- 764 Jones St
- 138 Moore St
- 784 Elmwood Dr
- 50 Walnut St
- 319 E Liberty St
- 110 School St
- 248 Myron St
- 114 Oakdale Ave
- 126 Stewart St
- 132 Drummond Ave
- 254 Christian Ave
- 3397 Pothour Wheeler Rd
- 531 Meadowland Dr
- 663 Meadowland Dr
- 279 Parish Ave
- 269 Westview Ave