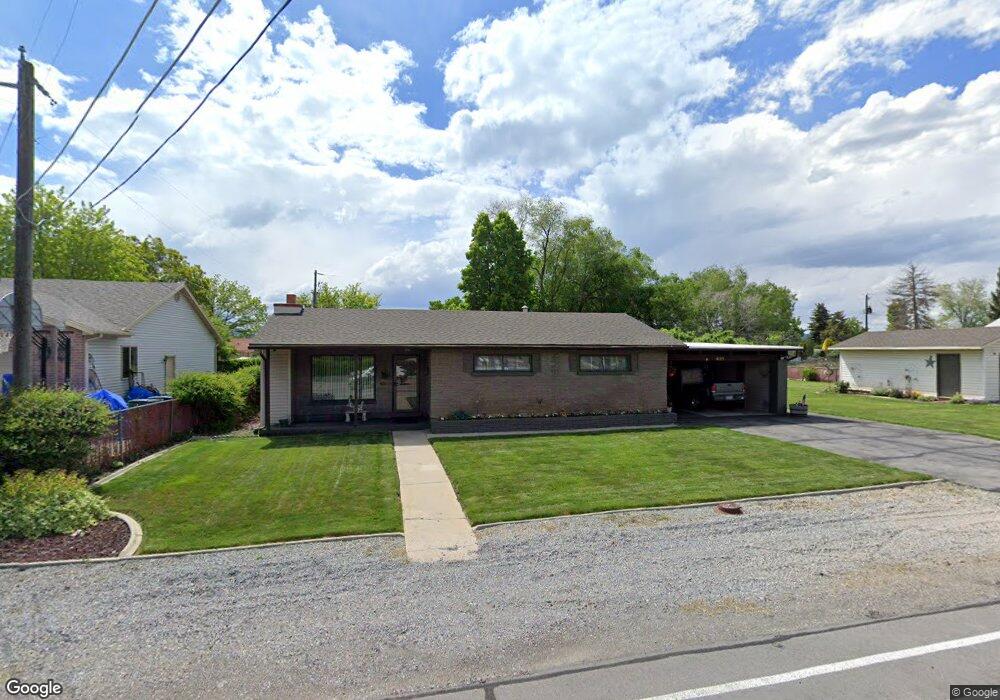
431 N 200 E Lindon, UT 84042
Estimated Value: $560,168 - $704,000
3
Beds
1
Bath
1,615
Sq Ft
$384/Sq Ft
Est. Value
About This Home
This home is located at 431 N 200 E, Lindon, UT 84042 and is currently estimated at $620,792, approximately $384 per square foot. 431 N 200 E is a home with nearby schools including Lindon Elementary School, Oak Canyon Junior High School, and Pleasant Grove High School.
Ownership History
Date
Name
Owned For
Owner Type
Purchase Details
Closed on
Mar 13, 2026
Sold by
Pulley Veloy and Veloy R Pulley Revocable Trust
Bought by
Niswander Cameron and Niswander Brittny
Current Estimated Value
Home Financials for this Owner
Home Financials are based on the most recent Mortgage that was taken out on this home.
Original Mortgage
$500,762
Outstanding Balance
$500,762
Interest Rate
6.1%
Mortgage Type
FHA
Estimated Equity
$120,030
Purchase Details
Closed on
Nov 21, 2017
Sold by
Pulley Veloy R and Pulley Brent J
Bought by
Pulley Veloy R and The Veloy R Pulley Revocable T
Purchase Details
Closed on
Jun 13, 2006
Sold by
Pulley Veloy R and Phillips Vicky Lynn
Bought by
Pulley Veloy R and Pulley Brent J
Create a Home Valuation Report for This Property
The Home Valuation Report is an in-depth analysis detailing your home's value as well as a comparison with similar homes in the area
Home Values in the Area
Average Home Value in this Area
Purchase History
| Date | Buyer | Sale Price | Title Company |
|---|---|---|---|
| Niswander Cameron | -- | Chicago Title | |
| Pulley Veloy R | -- | Atlas Title | |
| Pulley Veloy R | -- | Accommodation |
Source: Public Records
Mortgage History
| Date | Status | Borrower | Loan Amount |
|---|---|---|---|
| Open | Niswander Cameron | $500,762 |
Source: Public Records
Tax History
| Year | Tax Paid | Tax Assessment Tax Assessment Total Assessment is a certain percentage of the fair market value that is determined by local assessors to be the total taxable value of land and additions on the property. | Land | Improvement |
|---|---|---|---|---|
| 2025 | $675 | $269,500 | -- | -- |
| 2024 | $675 | $255,750 | $0 | $0 |
| 2023 | $366 | $263,450 | $0 | $0 |
| 2022 | $689 | $259,050 | $0 | $0 |
| 2021 | $439 | $322,800 | $189,200 | $133,600 |
| 2020 | $356 | $294,900 | $168,900 | $126,000 |
| 2019 | $1,327 | $262,800 | $144,800 | $118,000 |
| 2018 | $367 | $231,300 | $128,700 | $102,600 |
| 2017 | $1,086 | $108,790 | $0 | $0 |
| 2016 | $210 | $95,755 | $0 | $0 |
| 2015 | $326 | $90,200 | $0 | $0 |
| 2014 | $186 | $76,505 | $0 | $0 |
Source: Public Records
Map
Nearby Homes
Your Personal Tour Guide
Ask me questions while you tour the home.