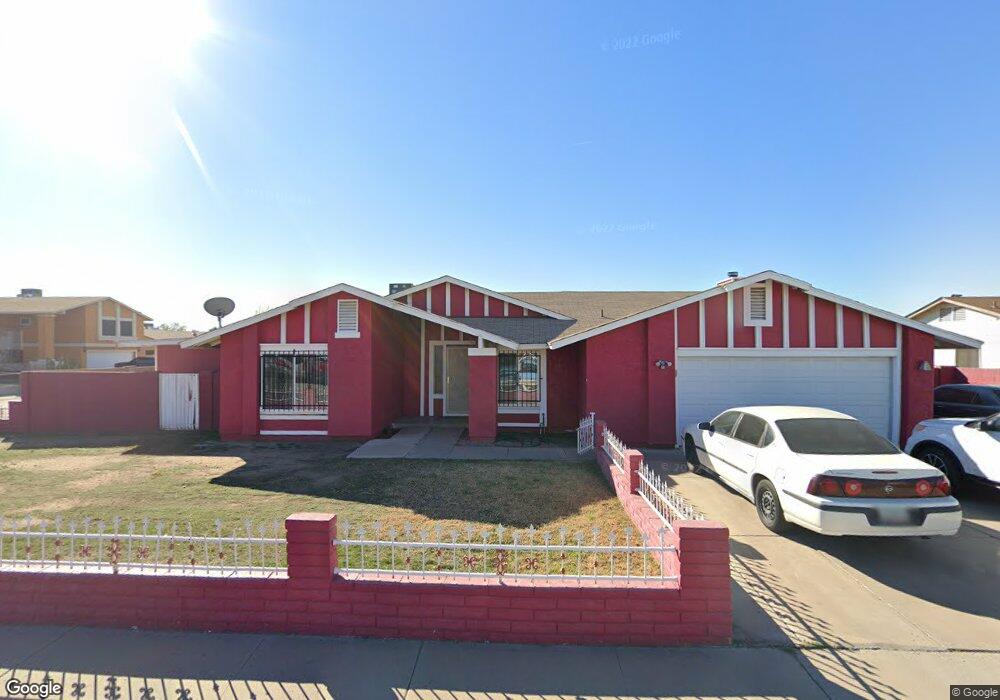
4311 W Wilshire Dr Phoenix, AZ 85035
Maryvale NeighborhoodEstimated Value: $297,000 - $409,000
--
Bed
2
Baths
1,734
Sq Ft
$202/Sq Ft
Est. Value
About This Home
This home is located at 4311 W Wilshire Dr, Phoenix, AZ 85035 and is currently estimated at $350,292, approximately $202 per square foot. 4311 W Wilshire Dr is a home located in Maricopa County with nearby schools including Joseph Zito Elementary School, Maryvale High School, and Phoenix Coding Academy.
Ownership History
Date
Name
Owned For
Owner Type
Purchase Details
Closed on
Jul 24, 2025
Sold by
Marshall Albert
Bought by
Albert Marshall Ii Revocable Living Trust and Marshall
Current Estimated Value
Purchase Details
Closed on
Apr 27, 2001
Sold by
Hud
Bought by
Marshall Ii Albert
Home Financials for this Owner
Home Financials are based on the most recent Mortgage that was taken out on this home.
Original Mortgage
$84,555
Interest Rate
7.03%
Mortgage Type
FHA
Purchase Details
Closed on
Nov 17, 2000
Sold by
Chase Manhattan Mtg Corp
Bought by
Hud
Purchase Details
Closed on
Nov 16, 2000
Sold by
Hernandez Braulio
Bought by
Chase Manhattan Mtg Corp
Purchase Details
Closed on
Jun 5, 1997
Sold by
Baltazar Nemorio and Baltazar Marie
Bought by
Hernandez Braulio
Home Financials for this Owner
Home Financials are based on the most recent Mortgage that was taken out on this home.
Original Mortgage
$90,644
Interest Rate
7.94%
Mortgage Type
New Conventional
Create a Home Valuation Report for This Property
The Home Valuation Report is an in-depth analysis detailing your home's value as well as a comparison with similar homes in the area
Home Values in the Area
Average Home Value in this Area
Purchase History
| Date | Buyer | Sale Price | Title Company |
|---|---|---|---|
| Albert Marshall Ii Revocable Living Trust | -- | None Listed On Document | |
| Marshall Ii Albert | -- | -- | |
| Hud | -- | First American Title | |
| Chase Manhattan Mtg Corp | $97,043 | First American Title | |
| Hernandez Braulio | $91,000 | Grand Canyon Title Agency In |
Source: Public Records
Mortgage History
| Date | Status | Borrower | Loan Amount |
|---|---|---|---|
| Previous Owner | Marshall Ii Albert | $84,555 | |
| Previous Owner | Hernandez Braulio | $90,644 |
Source: Public Records
Tax History Compared to Growth
Tax History
| Year | Tax Paid | Tax Assessment Tax Assessment Total Assessment is a certain percentage of the fair market value that is determined by local assessors to be the total taxable value of land and additions on the property. | Land | Improvement |
|---|---|---|---|---|
| 2025 | $2,375 | $16,171 | -- | -- |
| 2024 | $2,341 | $15,401 | -- | -- |
| 2023 | $2,341 | $28,920 | $5,780 | $23,140 |
| 2022 | $2,220 | $23,320 | $4,660 | $18,660 |
| 2021 | $2,131 | $21,160 | $4,230 | $16,930 |
| 2020 | $2,084 | $19,820 | $3,960 | $15,860 |
| 2019 | $2,038 | $16,760 | $3,350 | $13,410 |
| 2018 | $1,121 | $14,650 | $2,930 | $11,720 |
| 2017 | $983 | $12,920 | $2,580 | $10,340 |
| 2016 | $954 | $12,000 | $2,400 | $9,600 |
| 2015 | $867 | $9,510 | $1,900 | $7,610 |
Source: Public Records
Map
Nearby Homes
- 2515 N 43rd Dr
- 4401 W Lewis Ave
- 4235 W Lewis Ave
- 4430 W Vernon Ave
- 2674 N 43rd Ave Unit D
- 2646 N 43rd Ave Unit B
- 2652 N 43rd Ave Unit C
- 2690 N 43rd Ave Unit D
- 4625 W Thomas Rd Unit 90
- 4625 W Thomas Rd Unit 57
- 4625 W Thomas Rd Unit 48
- 2847 N 46th Ave Unit 10
- 2846 N 46th Ave Unit 3
- 4338 W Thomas Rd
- 2720 N 40th Ave
- 3946 W Holly St
- 3062 N 42nd Ave
- 3952 W Hubbell St
- 2511 N 48th Dr
- 4460 W Avalon Dr
- 4319 W Wilshire Dr
- 4312 W Sheridan St
- 4316 W Sheridan St
- 4312 W Wilshire Dr
- 2539 N 43rd Dr
- 4325 W Wilshire Dr Unit 2
- 2533 N 43rd Dr Unit 2
- 4318 W Wilshire Dr
- 4324 W Sheridan St
- 4306 W Wilshire Dr Unit 2
- 2545 N 43rd Dr
- 2527 N 43rd Dr
- 4324 W Wilshire Dr
- 4401 W Wilshire Dr
- 4402 W Sheridan St
- 4309 W Virginia Ave
- 2521 N 43rd Dr
- 4311 W Sheridan St
- 2551 N 44th Ave Unit 2
- 4319 W Sheridan St