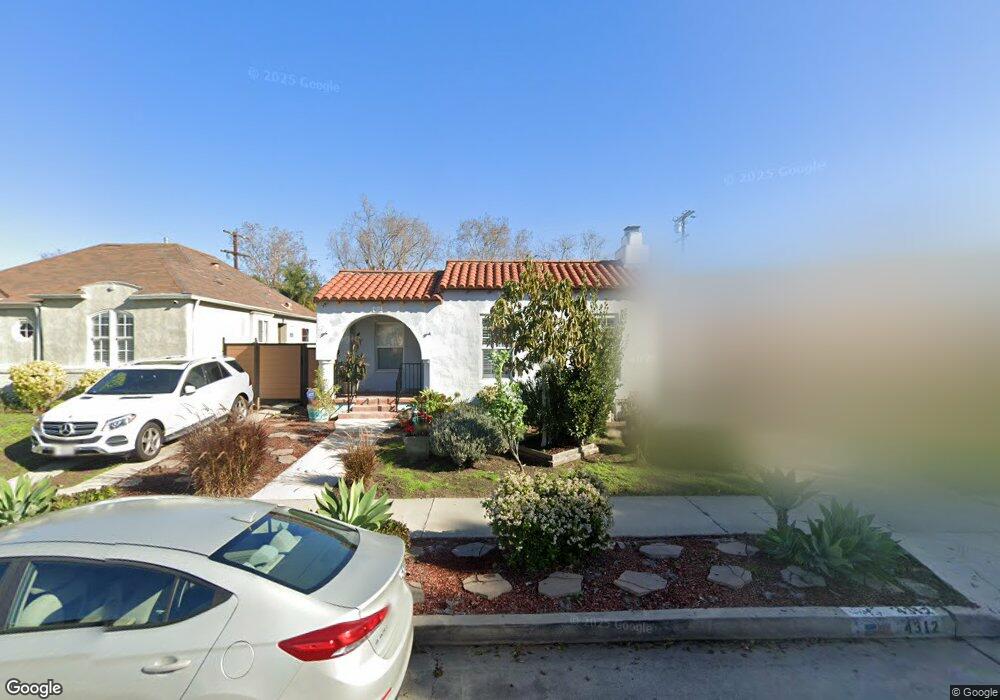
4312 5th Ave Los Angeles, CA 90008
Leimert Park NeighborhoodEstimated Value: $882,247 - $1,024,000
3
Beds
2
Baths
1,561
Sq Ft
$604/Sq Ft
Est. Value
About This Home
This home is located at 4312 5th Ave, Los Angeles, CA 90008 and is currently estimated at $943,562, approximately $604 per square foot. 4312 5th Ave is a home located in Los Angeles County with nearby schools including Forty-Second Street Elementary School, Audubon Middle School, and Crenshaw Science, Technology, Engineering, Math And Medicine Magnet.
Ownership History
Date
Name
Owned For
Owner Type
Purchase Details
Closed on
Jun 1, 2008
Sold by
Turner Damon C
Bought by
Turner Damon C
Current Estimated Value
Purchase Details
Closed on
Jun 24, 1998
Sold by
Deborah Pegues Darnell and Deborah Pegues Smith Pegues
Bought by
Turner Damon C
Home Financials for this Owner
Home Financials are based on the most recent Mortgage that was taken out on this home.
Original Mortgage
$157,783
Outstanding Balance
$30,642
Interest Rate
7.03%
Mortgage Type
FHA
Estimated Equity
$912,920
Create a Home Valuation Report for This Property
The Home Valuation Report is an in-depth analysis detailing your home's value as well as a comparison with similar homes in the area
Home Values in the Area
Average Home Value in this Area
Purchase History
| Date | Buyer | Sale Price | Title Company |
|---|---|---|---|
| Turner Damon C | -- | None Available | |
| Turner Damon C | $163,000 | South Coast Title |
Source: Public Records
Mortgage History
| Date | Status | Borrower | Loan Amount |
|---|---|---|---|
| Open | Turner Damon C | $157,783 |
Source: Public Records
Tax History Compared to Growth
Tax History
| Year | Tax Paid | Tax Assessment Tax Assessment Total Assessment is a certain percentage of the fair market value that is determined by local assessors to be the total taxable value of land and additions on the property. | Land | Improvement |
|---|---|---|---|---|
| 2025 | $3,371 | $255,511 | $185,919 | $69,592 |
| 2024 | $3,299 | $250,502 | $182,274 | $68,228 |
| 2023 | $3,243 | $245,591 | $178,700 | $66,891 |
| 2022 | $3,103 | $240,777 | $175,197 | $65,580 |
| 2021 | $3,056 | $236,057 | $171,762 | $64,295 |
| 2019 | $2,970 | $229,057 | $166,668 | $62,389 |
| 2018 | $2,892 | $224,566 | $163,400 | $61,166 |
| 2016 | $2,755 | $215,848 | $157,056 | $58,792 |
| 2015 | $2,717 | $212,606 | $154,697 | $57,909 |
| 2014 | $2,735 | $208,442 | $151,667 | $56,775 |
Source: Public Records
Map
Nearby Homes
- 2627 W Vernon Ave
- 4309 Sutro Ave
- 4238 3rd Ave
- 4340 2nd Ave
- 4301 Arlington Ave
- 4508 7th Ave
- 4524 7th Ave
- 4174 3rd Ave
- 4524 2nd Ave
- 3104 W 43rd Place
- 4116 Garthwaite Ave
- 4247 9th Ave
- 3008 Stocker St
- 4172 -4180 Leimert Blvd
- 4528 Arlington Ave
- 2025 W Vernon Ave
- 2015 W 42nd Place
- 4622 9th Ave
- 4116 2nd Ave
- 1933 W 43rd Place