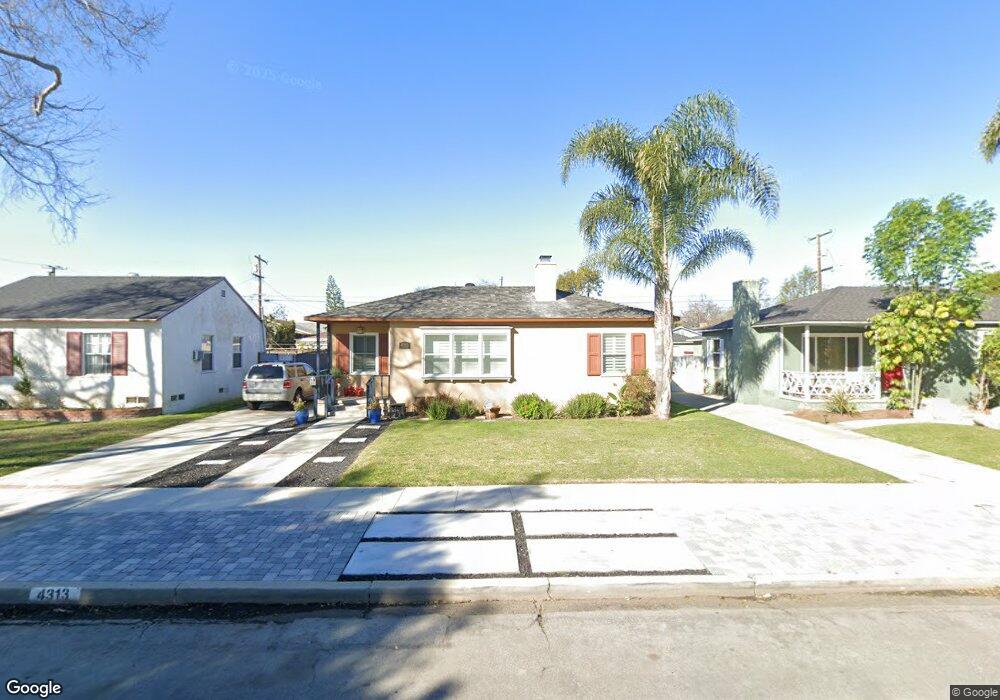
4313 Walnut Ave Long Beach, CA 90807
Bixby Knolls NeighborhoodEstimated Value: $857,645 - $1,017,000
2
Beds
2
Baths
1,012
Sq Ft
$902/Sq Ft
Est. Value
About This Home
This home is located at 4313 Walnut Ave, Long Beach, CA 90807 and is currently estimated at $912,911, approximately $902 per square foot. 4313 Walnut Ave is a home located in Los Angeles County with nearby schools including Longfellow Elementary School, Hughes Middle School, and Long Beach Polytechnic High School.
Ownership History
Date
Name
Owned For
Owner Type
Purchase Details
Closed on
Jul 20, 2009
Sold by
Reese Jodi R
Bought by
Troeak William Joseph and Troeak Debra Lee
Current Estimated Value
Home Financials for this Owner
Home Financials are based on the most recent Mortgage that was taken out on this home.
Original Mortgage
$439,755
Interest Rate
5.25%
Mortgage Type
VA
Purchase Details
Closed on
Apr 12, 2000
Sold by
Tapia Francisco
Bought by
Reese Jodi R
Home Financials for this Owner
Home Financials are based on the most recent Mortgage that was taken out on this home.
Original Mortgage
$178,429
Interest Rate
8.22%
Mortgage Type
FHA
Purchase Details
Closed on
Feb 6, 1996
Sold by
Irlen Helen L
Bought by
Tapia Francisco and Tapia Lucy
Home Financials for this Owner
Home Financials are based on the most recent Mortgage that was taken out on this home.
Original Mortgage
$118,750
Interest Rate
7.05%
Purchase Details
Closed on
Jan 26, 1994
Sold by
Irlen Helen I
Bought by
Irlen Robert A and Irlen Helen L
Create a Home Valuation Report for This Property
The Home Valuation Report is an in-depth analysis detailing your home's value as well as a comparison with similar homes in the area
Home Values in the Area
Average Home Value in this Area
Purchase History
| Date | Buyer | Sale Price | Title Company |
|---|---|---|---|
| Troeak William Joseph | $435,000 | North American Title Company | |
| Reese Jodi R | $180,000 | North American Title Co | |
| Tapia Francisco | $125,000 | South Coast Title | |
| Irlen Robert A | -- | -- |
Source: Public Records
Mortgage History
| Date | Status | Borrower | Loan Amount |
|---|---|---|---|
| Previous Owner | Troeak William Joseph | $439,755 | |
| Previous Owner | Reese Jodi R | $178,429 | |
| Previous Owner | Tapia Francisco | $118,750 |
Source: Public Records
Tax History
| Year | Tax Paid | Tax Assessment Tax Assessment Total Assessment is a certain percentage of the fair market value that is determined by local assessors to be the total taxable value of land and additions on the property. | Land | Improvement |
|---|---|---|---|---|
| 2025 | $7,094 | $561,489 | $445,324 | $116,165 |
| 2024 | $7,094 | $550,481 | $436,593 | $113,888 |
| 2023 | $6,972 | $539,688 | $428,033 | $111,655 |
| 2022 | $6,543 | $529,107 | $419,641 | $109,466 |
| 2021 | $6,413 | $518,733 | $411,413 | $107,320 |
| 2019 | $6,319 | $503,349 | $399,211 | $104,138 |
| 2018 | $6,146 | $493,481 | $391,384 | $102,097 |
| 2016 | $5,655 | $474,321 | $376,187 | $98,134 |
| 2015 | $5,098 | $438,000 | $348,000 | $90,000 |
| 2014 | $4,159 | $350,000 | $278,000 | $72,000 |
Source: Public Records
Map
Nearby Homes
- 4316 Falcon Ave
- 4251 Gundry Ave
- 4155 Keever Ave
- 4472 Gundry Ave
- 4456 Boyar Ave
- 4637 Falcon Ave
- 3965 N Marshall Way
- 3565 3565 Linden Unit 235
- 4420 Myrtle Ave
- 3901 Cherry Ave
- 3928 Lemon Ave
- 4485 Myrtle Ave
- 1450 E Armando Dr
- 1048 E 45th Way
- 4318 Maybank Ave
- 1071 E 46th St
- 4642 Vangold Ave
- 1124 E Ridgewood St
- 4415 Lime Ave
- 3930 Myrtle Ave
- 4325 Walnut Ave
- 4301 Walnut Ave
- 4337 Walnut Ave
- 4308 Falcon Ave
- 4324 Falcon Ave
- 4300 Falcon Ave
- 4300 Walnut Ave
- 4349 Walnut Ave
- 4312 Walnut Ave
- 4332 Falcon Ave
- 4324 Walnut Ave
- 4247 Walnut Ave
- 4336 Walnut Ave
- 4340 Falcon Ave
- 4361 Walnut Ave
- 4248 Walnut Ave
- 4348 Walnut Ave
- 4260 Falcon Ave
- 4241 Walnut Ave
- 4348 Falcon Ave
Your Personal Tour Guide
Ask me questions while you tour the home.