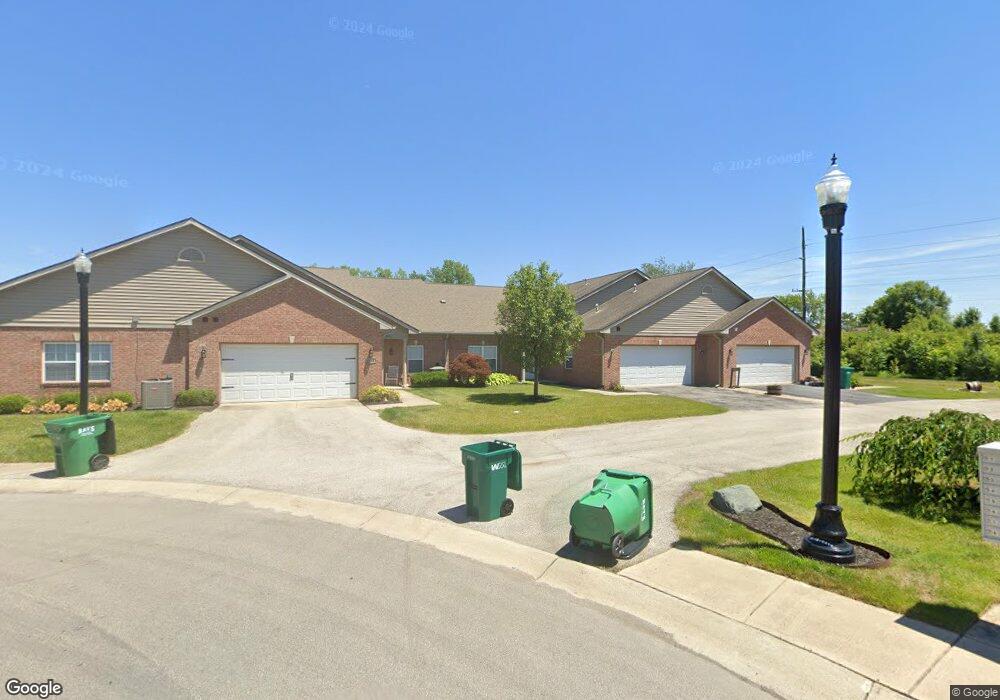
4313 Washington Blvd Plainfield, IN 46168
Estimated Value: $238,402 - $257,000
2
Beds
2
Baths
1,472
Sq Ft
$169/Sq Ft
Est. Value
About This Home
This home is located at 4313 Washington Blvd, Plainfield, IN 46168 and is currently estimated at $248,101, approximately $168 per square foot. 4313 Washington Blvd is a home located in Hendricks County with nearby schools including Central Elementary School, Plainfield Community Middle School, and Plainfield High School.
Ownership History
Date
Name
Owned For
Owner Type
Purchase Details
Closed on
Apr 22, 2019
Sold by
Harwood Janet and Harwood Karen A
Bought by
Rader Matthew R
Current Estimated Value
Home Financials for this Owner
Home Financials are based on the most recent Mortgage that was taken out on this home.
Original Mortgage
$161,000
Outstanding Balance
$141,260
Interest Rate
4.2%
Mortgage Type
VA
Estimated Equity
$106,841
Purchase Details
Closed on
Jul 11, 2014
Sold by
Harwood Janet
Bought by
Harwood Karen A and Harwood Janet
Purchase Details
Closed on
Nov 10, 2010
Sold by
The Springs At Saratoga Llc
Bought by
Harwood Janet
Home Financials for this Owner
Home Financials are based on the most recent Mortgage that was taken out on this home.
Original Mortgage
$88,000
Interest Rate
4.37%
Mortgage Type
New Conventional
Create a Home Valuation Report for This Property
The Home Valuation Report is an in-depth analysis detailing your home's value as well as a comparison with similar homes in the area
Home Values in the Area
Average Home Value in this Area
Purchase History
| Date | Buyer | Sale Price | Title Company |
|---|---|---|---|
| Rader Matthew R | $161,000 | Abstract & Title Guaranty Co I | |
| Harwood Karen A | -- | -- | |
| Harwood Janet | -- | Chicago Title Insurance Co |
Source: Public Records
Mortgage History
| Date | Status | Borrower | Loan Amount |
|---|---|---|---|
| Open | Rader Matthew R | $161,000 | |
| Previous Owner | Harwood Janet | $88,000 |
Source: Public Records
Tax History Compared to Growth
Tax History
| Year | Tax Paid | Tax Assessment Tax Assessment Total Assessment is a certain percentage of the fair market value that is determined by local assessors to be the total taxable value of land and additions on the property. | Land | Improvement |
|---|---|---|---|---|
| 2024 | $907 | $190,600 | $27,300 | $163,300 |
| 2023 | $783 | $183,300 | $26,000 | $157,300 |
| 2022 | $889 | $181,800 | $25,400 | $156,400 |
| 2021 | $767 | $170,500 | $25,400 | $145,100 |
| 2020 | $523 | $151,000 | $23,400 | $127,600 |
| 2019 | $464 | $144,500 | $22,000 | $122,500 |
| 2018 | $1,235 | $145,900 | $22,000 | $123,900 |
| 2017 | $1,155 | $135,500 | $20,400 | $115,100 |
| 2016 | $1,088 | $130,800 | $20,400 | $110,400 |
| 2014 | $1,176 | $134,700 | $21,000 | $113,700 |
Source: Public Records
Map
Nearby Homes
- 4311 Washington Blvd
- 4285 Washington Blvd
- 4261 Washington Blvd
- 4321 Hamilton Way Unit 22-A
- 4227 Washington Blvd
- 4533 Gordon Dr
- 5374 John Quincy Adams Ct
- 4145 Lotus St
- 4160 Lotus St
- 4088 Del Mar Ln
- 5716 Kensington Blvd
- 4081 Lotus St
- Foxhall Plan at Saratoga Village - Frontload
- Edinburgh Plan at Saratoga Village - Frontload
- Meridian III Plan at Saratoga Village - Rearload
- Madison Plan at Saratoga Village - Rearload
- Talbott II Plan at Saratoga Village - Rearload
- 5883 Farwell Ave
- 5875 Farwell Ave
- 4774 Marshall Dr
- 4313 Washington Blvd Unit 19 B
- 4315 Washington Blvd
- 4309 Washington Blvd
- 5655 Jones Dr
- 5653 Jones Dr
- 5660 Jones Dr Unit 17
- 4293 Washington Blvd
- 4293 Washington Blvd Unit 18
- 4330 Washington Blvd Unit 17
- 4330 Washington Blvd
- 4330 Washington Blvd Unit C
- 5649 Jones Dr
- 4291 Washington Blvd
- 5656 Jones Dr Unit 22-D
- 5656 Jones Dr Unit 2-D
- 5656 Jones Dr Unit 22-C
- 5652 Jones Dr Dr Unit 22-B
- 4328 Washington Blvd Unit 17-A
- 5654 Jones Dr Unit 22-c
- 5654 Jones Dr Unit 22-B