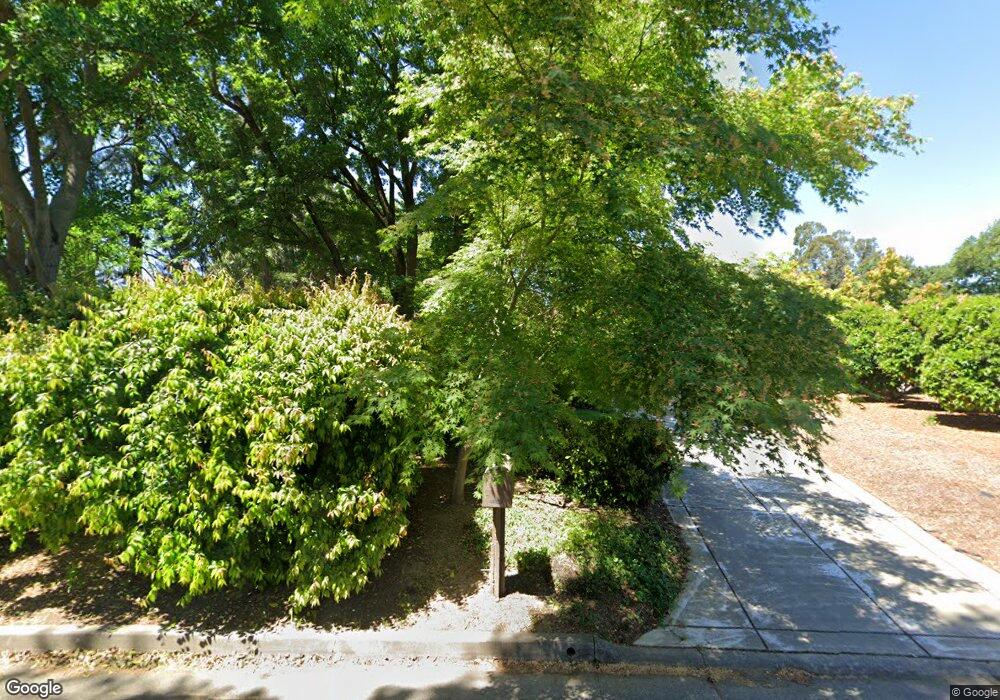
43134 W Oakside Place Davis, CA 95618
South Davis NeighborhoodEstimated Value: $1,119,000 - $1,866,000
3
Beds
4
Baths
3,096
Sq Ft
$455/Sq Ft
Est. Value
About This Home
This home is located at 43134 W Oakside Place, Davis, CA 95618 and is currently estimated at $1,409,832, approximately $455 per square foot. 43134 W Oakside Place is a home located in Yolo County with nearby schools including Marguerite Montgomery Elementary School, Frances Ellen Watkins Harper Junior High School, and Davis Senior High School.
Ownership History
Date
Name
Owned For
Owner Type
Purchase Details
Closed on
Jan 13, 2004
Sold by
Matteson Gary C and Matteson Jane L
Bought by
Matteson Gary C and Matteson Jane L
Current Estimated Value
Home Financials for this Owner
Home Financials are based on the most recent Mortgage that was taken out on this home.
Original Mortgage
$203,000
Interest Rate
5.79%
Mortgage Type
New Conventional
Purchase Details
Closed on
Apr 16, 1999
Sold by
Matteson Gary C & Jane L Tr
Bought by
Matteson Gary C and Matteson Jane L
Home Financials for this Owner
Home Financials are based on the most recent Mortgage that was taken out on this home.
Original Mortgage
$135,000
Interest Rate
6.7%
Purchase Details
Closed on
Mar 1, 1999
Sold by
Matteson Gary C & Jane L Tr
Bought by
Matteson Gary C and Matteson Jane L
Home Financials for this Owner
Home Financials are based on the most recent Mortgage that was taken out on this home.
Original Mortgage
$135,000
Interest Rate
6.7%
Purchase Details
Closed on
Sep 15, 1991
Sold by
Matteson Gary C and Matteson Jane L
Bought by
Matteson Gary C and Matteson Jane L
Create a Home Valuation Report for This Property
The Home Valuation Report is an in-depth analysis detailing your home's value as well as a comparison with similar homes in the area
Home Values in the Area
Average Home Value in this Area
Purchase History
| Date | Buyer | Sale Price | Title Company |
|---|---|---|---|
| Matteson Gary C | -- | First American Title Ins Co | |
| Matteson Gary C | -- | First American Title Ins Co | |
| Matteson Gary C | -- | -- | |
| Matteson Gary C | -- | Financial Title Company | |
| Matteson Gary C | -- | -- |
Source: Public Records
Mortgage History
| Date | Status | Borrower | Loan Amount |
|---|---|---|---|
| Closed | Matteson Gary C | $203,000 | |
| Closed | Matteson Gary C | $135,000 |
Source: Public Records
Tax History
| Year | Tax Paid | Tax Assessment Tax Assessment Total Assessment is a certain percentage of the fair market value that is determined by local assessors to be the total taxable value of land and additions on the property. | Land | Improvement |
|---|---|---|---|---|
| 2025 | $3,184 | $270,937 | $34,165 | $236,772 |
| 2023 | $3,184 | $260,419 | $32,840 | $227,579 |
| 2022 | $3,280 | $255,314 | $32,197 | $223,117 |
| 2021 | $3,219 | $250,309 | $31,566 | $218,743 |
| 2020 | $3,174 | $247,744 | $31,243 | $216,501 |
| 2019 | $3,120 | $242,887 | $30,631 | $212,256 |
| 2018 | $2,918 | $238,126 | $30,031 | $208,095 |
| 2017 | $2,864 | $233,458 | $29,443 | $204,015 |
| 2016 | $2,817 | $228,881 | $28,866 | $200,015 |
| 2015 | $3,039 | $225,444 | $28,433 | $197,011 |
| 2014 | $3,039 | $221,029 | $27,877 | $193,152 |
Source: Public Records
Map
Nearby Homes
- 43120 Montgomery Ave
- 3423 Monte Vista Ave
- 3180 Albany Cir
- 3723 Modoc Place
- 4007 Nandina Place
- 1327 Torrey St
- 4108 Tallow Place
- 1175 Greene Terrace
- 1107 Greene Terrace Unit 5101
- 217 La Vida Way
- 1174 Greene Terrace
- 4318 Cowell Blvd
- 119 Hedy Ln
- 103 Full Cir
- 124 Hedy Ln
- 3224 Via Verde Terrace
- 1120 Colina Ct
- 143 Louise Ln
- 86 Lyle Way
- 64 Artis Ln
- 43146 W Oakside Place
- 43158 W Oakside Place
- 43110 W Oakside Place
- 43151 W Oakside Place
- 43139 W Oakside Place
- 43102 W Oakside Place
- 43170 W Oakside Place
- 43115 W Oakside Place
- 27410 Oakside Dr
- 43127 W Oakside Place
- 27434 Oakside Dr
- 1248 Drummond S
- 43182 W Oakside Place
- 43136 Montgomery Ave
- 27446 Oakside Dr
- 43116 Montgomery Ave Unit 20
- 43112 Montgomery Ave
- 43154 Montgomery Ave
- 27462 Oakside Dr
- 43200 E Oakside Place
Your Personal Tour Guide
Ask me questions while you tour the home.