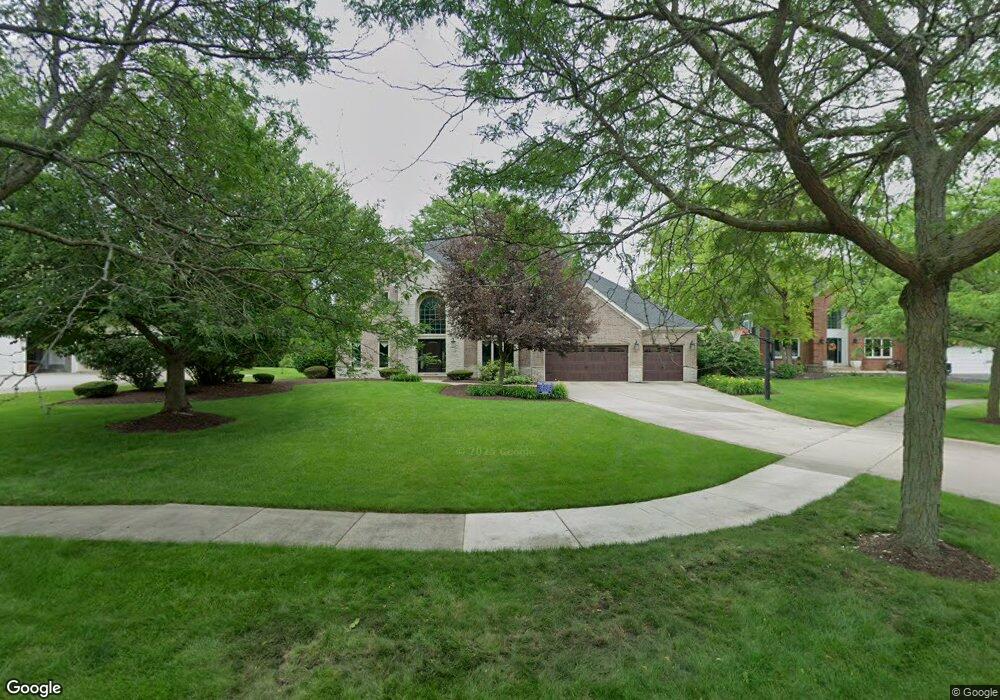
4316 Ariel Ct Unit 1 Naperville, IL 60564
River Run NeighborhoodEstimated Value: $950,000 - $1,293,000
4
Beds
4
Baths
3,722
Sq Ft
$286/Sq Ft
Est. Value
About This Home
This home is located at 4316 Ariel Ct Unit 1, Naperville, IL 60564 and is currently estimated at $1,064,973, approximately $286 per square foot. 4316 Ariel Ct Unit 1 is a home located in Will County with nearby schools including Graham Elementary School, Ellsworth Elementary School, and Clifford Crone Middle School.
Ownership History
Date
Name
Owned For
Owner Type
Purchase Details
Closed on
May 19, 2011
Sold by
Bull Evan and Bull Deborah
Bought by
Johnson Anthony J and Johnson Leigh E
Current Estimated Value
Home Financials for this Owner
Home Financials are based on the most recent Mortgage that was taken out on this home.
Original Mortgage
$417,000
Outstanding Balance
$288,725
Interest Rate
4.8%
Mortgage Type
New Conventional
Estimated Equity
$776,248
Purchase Details
Closed on
Mar 20, 1995
Sold by
Oliver Hoffmann Corp
Bought by
Bull Evan and Bull Deborah
Home Financials for this Owner
Home Financials are based on the most recent Mortgage that was taken out on this home.
Original Mortgage
$300,000
Interest Rate
7.62%
Create a Home Valuation Report for This Property
The Home Valuation Report is an in-depth analysis detailing your home's value as well as a comparison with similar homes in the area
Home Values in the Area
Average Home Value in this Area
Purchase History
| Date | Buyer | Sale Price | Title Company |
|---|---|---|---|
| Johnson Anthony J | $650,000 | First American Title | |
| Bull Evan | $375,000 | -- |
Source: Public Records
Mortgage History
| Date | Status | Borrower | Loan Amount |
|---|---|---|---|
| Open | Johnson Anthony J | $417,000 | |
| Previous Owner | Bull Evan | $300,000 |
Source: Public Records
Tax History Compared to Growth
Tax History
| Year | Tax Paid | Tax Assessment Tax Assessment Total Assessment is a certain percentage of the fair market value that is determined by local assessors to be the total taxable value of land and additions on the property. | Land | Improvement |
|---|---|---|---|---|
| 2024 | $17,259 | $271,495 | $60,808 | $210,687 |
| 2023 | $17,259 | $239,836 | $53,717 | $186,119 |
| 2022 | $15,687 | $222,520 | $50,815 | $171,705 |
| 2021 | $15,000 | $211,924 | $48,395 | $163,529 |
| 2020 | $14,717 | $208,566 | $47,628 | $160,938 |
| 2019 | $14,468 | $202,688 | $46,286 | $156,402 |
| 2018 | $14,560 | $200,362 | $45,268 | $155,094 |
| 2017 | $14,341 | $195,189 | $44,099 | $151,090 |
| 2016 | $14,317 | $190,988 | $43,150 | $147,838 |
| 2015 | $15,269 | $183,642 | $41,490 | $142,152 |
| 2014 | $15,269 | $188,580 | $41,490 | $147,090 |
| 2013 | $15,269 | $188,580 | $41,490 | $147,090 |
Source: Public Records
Map
Nearby Homes
- 1736 Robert Ln
- 1804 Princess Cir
- 2255 Wendt Cir
- 1112 Saratoga Ct
- 3616 Eliot Ln
- 4007 Heron Ct Unit 1
- 3816 Rosada Dr
- 29W316 Andermann Dr
- 2711 Wait Rd
- 3432 Caine Dr
- 1987 Baldwin Way
- 620 Redtop Way
- 620 Switchgrass Way Unit 61006
- 2339 Ryegrass Ln Unit 64005
- 2335 Ryegrass Ln Unit 64004
- 668 Switchgrass Way Unit 58004
- 688 Switchgrass Way Unit 57003
- 596 Redtop Way
- 2241 Bent Grass Way
- 592 Redtop Way
- 4312 Ariel Ct
- 4320 Ariel Ct
- 4316 Camelot Cir
- 4312 Camelot Cir
- 4308 Ariel Ct
- 4324 Ariel Ct
- 4320 Camelot Cir
- 4315 Ariel Ct
- 4308 Camelot Cir
- 4319 Ariel Ct
- 4327 Ariel Ct
- 4311 Ariel Ct
- 4323 Ariel Ct
- 4324 Camelot Cir
- 4304 Ariel Ct
- 4304 Camelot Cir
- 4307 Ariel Ct
- 4336 Camelot Cir
- 4311 Camelot Cir
- 4315 Camelot Cir