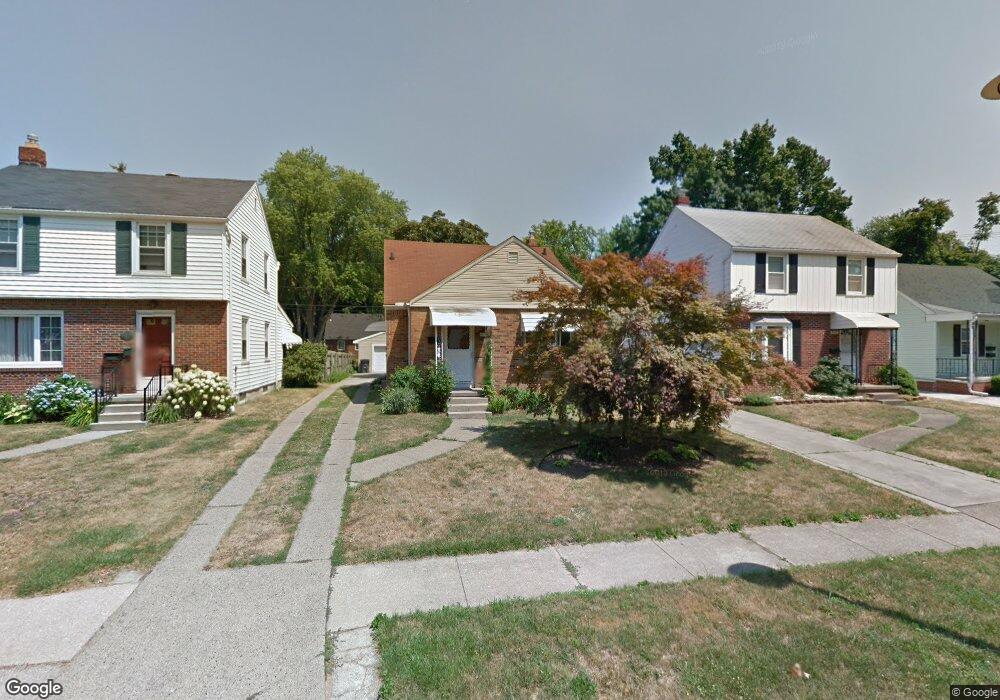
4316 Garrison Rd Toledo, OH 43613
DeVeaux NeighborhoodEstimated Value: $165,000 - $181,000
3
Beds
1
Bath
1,367
Sq Ft
$128/Sq Ft
Est. Value
About This Home
This home is located at 4316 Garrison Rd, Toledo, OH 43613 and is currently estimated at $175,545, approximately $128 per square foot. 4316 Garrison Rd is a home located in Lucas County with nearby schools including Elmhurst Elementary School, Start High School, and Horizon Science Academy - Toledo High School.
Ownership History
Date
Name
Owned For
Owner Type
Purchase Details
Closed on
Oct 29, 2020
Sold by
Santus Wick Toni Lyn and Wick David K
Bought by
Santus Wick Toni Lyn and Wick David K
Current Estimated Value
Home Financials for this Owner
Home Financials are based on the most recent Mortgage that was taken out on this home.
Original Mortgage
$72,000
Outstanding Balance
$52,117
Interest Rate
2.9%
Mortgage Type
New Conventional
Estimated Equity
$123,428
Purchase Details
Closed on
Nov 30, 1998
Sold by
Njaim Julie A and Buehler Julie A
Bought by
Santus Toni L
Home Financials for this Owner
Home Financials are based on the most recent Mortgage that was taken out on this home.
Original Mortgage
$76,950
Interest Rate
6.8%
Purchase Details
Closed on
Dec 1, 1993
Sold by
Minnich Stephen G and Minnich Terry
Purchase Details
Closed on
Aug 18, 1988
Sold by
Parks Robert
Create a Home Valuation Report for This Property
The Home Valuation Report is an in-depth analysis detailing your home's value as well as a comparison with similar homes in the area
Home Values in the Area
Average Home Value in this Area
Purchase History
| Date | Buyer | Sale Price | Title Company |
|---|---|---|---|
| Santus Wick Toni Lyn | -- | None Available | |
| Santus Toni L | $85,500 | Louisville Title Agency For | |
| -- | $61,000 | -- | |
| -- | $51,000 | -- |
Source: Public Records
Mortgage History
| Date | Status | Borrower | Loan Amount |
|---|---|---|---|
| Open | Santus Wick Toni Lyn | $72,000 | |
| Closed | Santus Toni L | $76,950 |
Source: Public Records
Tax History Compared to Growth
Tax History
| Year | Tax Paid | Tax Assessment Tax Assessment Total Assessment is a certain percentage of the fair market value that is determined by local assessors to be the total taxable value of land and additions on the property. | Land | Improvement |
|---|---|---|---|---|
| 2024 | $1,421 | $47,110 | $6,720 | $40,390 |
| 2023 | $2,246 | $35,385 | $6,090 | $29,295 |
| 2022 | $2,243 | $35,385 | $6,090 | $29,295 |
| 2021 | $2,302 | $35,385 | $6,090 | $29,295 |
| 2020 | $2,194 | $29,855 | $5,040 | $24,815 |
| 2019 | $2,145 | $29,855 | $5,040 | $24,815 |
| 2018 | $2,090 | $29,855 | $5,040 | $24,815 |
| 2017 | $2,068 | $27,265 | $3,325 | $23,940 |
| 2016 | $2,059 | $77,900 | $9,500 | $68,400 |
| 2015 | $2,038 | $77,900 | $9,500 | $68,400 |
| 2014 | $1,715 | $27,270 | $3,330 | $23,940 |
| 2013 | $1,715 | $27,270 | $3,330 | $23,940 |
Source: Public Records
Map
Nearby Homes
- 4250 Garrison Rd
- 2855 Castleton Ave
- 4210 Bowen Rd
- 4440 Woodmont Rd
- 2645 Westbrook Dr
- 2645 Grantwood Dr
- 2640 Westbrook Dr
- 2728 Castleton Ave
- 2842 Oak Grove Place
- 2659 Oak Grove Place
- 2513 Grantwood Dr
- 4807 Brott Rd
- 3951 Buell Ave
- 4220 Douglas Rd
- 3840 Garrison Rd
- 3840 Grantley Rd
- 3905 Rushland Ave
- 2820 Claredale Rd
- 2560 Charlestown Ave
- 2605 Wyndale Rd
- 4320 Garrison Rd
- 4312 Garrison Rd
- 4308 Garrison Rd
- 4324 Garrison Rd
- 4330 Garrison Rd
- 4304 Garrison Rd
- 4328 Garrison Rd
- 4319 Grantley Rd
- 4311 Grantley Rd
- 4307 Grantley Rd
- 4325 Grantley Rd
- 2836 Grantwood Dr
- 4319 Garrison Rd
- 4315 Garrison Rd
- 4323 Garrison Rd
- 4307 Garrison Rd
- 4254 Garrison Rd
- 4301 Garrison Rd
- 4327 Garrison Rd
- 2850 Westbrook Dr