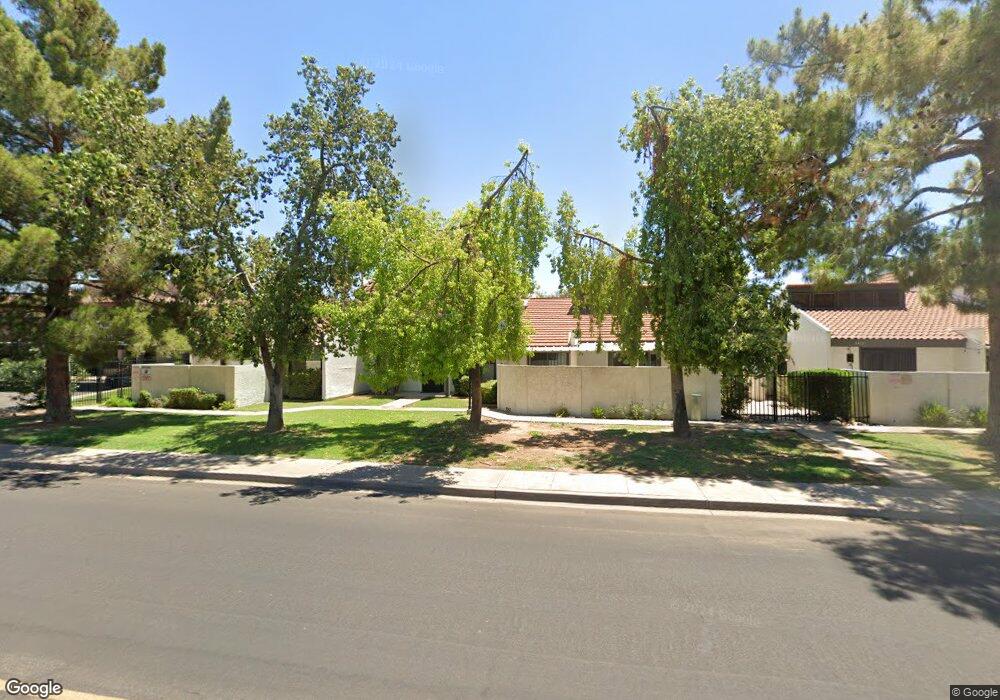
4317 N 28th St Phoenix, AZ 85016
Camelback East Village NeighborhoodEstimated Value: $333,000 - $388,000
Studio
2
Baths
1,182
Sq Ft
$302/Sq Ft
Est. Value
About This Home
This home is located at 4317 N 28th St, Phoenix, AZ 85016 and is currently estimated at $356,514, approximately $301 per square foot. 4317 N 28th St is a home located in Maricopa County with nearby schools including Madison Camelview Elementary, Camelback High School, and Phoenix Coding Academy.
Ownership History
Date
Name
Owned For
Owner Type
Purchase Details
Closed on
May 22, 2008
Sold by
Williams Tyler
Bought by
Williams Tara
Current Estimated Value
Purchase Details
Closed on
Jul 17, 2007
Sold by
Williamson Deshannon
Bought by
Overfield Tara
Home Financials for this Owner
Home Financials are based on the most recent Mortgage that was taken out on this home.
Original Mortgage
$179,200
Outstanding Balance
$113,344
Interest Rate
6.73%
Mortgage Type
VA
Estimated Equity
$243,170
Purchase Details
Closed on
Jun 22, 2005
Sold by
Williamson Vanessa
Bought by
Williamson Deshannon
Home Financials for this Owner
Home Financials are based on the most recent Mortgage that was taken out on this home.
Original Mortgage
$143,500
Interest Rate
6.62%
Mortgage Type
Adjustable Rate Mortgage/ARM
Purchase Details
Closed on
Mar 6, 2002
Sold by
Pilgrim Kevin A and Lindsey Arlene
Bought by
Evans Camille
Home Financials for this Owner
Home Financials are based on the most recent Mortgage that was taken out on this home.
Original Mortgage
$94,158
Interest Rate
6.84%
Mortgage Type
FHA
Purchase Details
Closed on
Sep 12, 2000
Sold by
Roberts Glenn A and Roberts Susan M
Bought by
Pilgrim Kevin A and Lindsey Arlene
Home Financials for this Owner
Home Financials are based on the most recent Mortgage that was taken out on this home.
Original Mortgage
$76,500
Interest Rate
8.07%
Mortgage Type
New Conventional
Purchase Details
Closed on
Mar 3, 1999
Sold by
G & S Roberts Associates
Bought by
Roberts Glenn A and Roberts Susan M
Home Financials for this Owner
Home Financials are based on the most recent Mortgage that was taken out on this home.
Original Mortgage
$55,000
Interest Rate
8.25%
Mortgage Type
Purchase Money Mortgage
Purchase Details
Closed on
Nov 19, 1998
Sold by
Roberts Glenn A and Roberts Susan M
Bought by
G & S Roberts Associates Ltd Partnership
Purchase Details
Closed on
May 11, 1998
Sold by
Rinne Geraldine
Bought by
Roberts Glenn A and Roberts Susan M
Home Financials for this Owner
Home Financials are based on the most recent Mortgage that was taken out on this home.
Original Mortgage
$19,000
Interest Rate
7.13%
Mortgage Type
Seller Take Back
Purchase Details
Closed on
Feb 9, 1996
Sold by
Rinne Roger
Bought by
Rinne Geraldine
Purchase Details
Closed on
Jan 23, 1996
Sold by
Copeland Nancy R and Rose Nancy E
Bought by
Rinne Geraldine
Create a Home Valuation Report for This Property
The Home Valuation Report is an in-depth analysis detailing your home's value as well as a comparison with similar homes in the area
Home Values in the Area
Average Home Value in this Area
Purchase History
We collect this data history from publicly available records. To have your information removed, we recommend requesting removal directly through your county’s website.
| Date | Buyer | Sale Price | Title Company |
|---|---|---|---|
| Williams Tara | -- | Transnation Title Ins Co | |
| Williams Tara | -- | Transnation Title Ins Co | |
| Overfield Tara | $175,000 | Camelback Title Agency Llc | |
| Williamson Deshannon | -- | Stewart Title & Trust Of Pho | |
| Williamson Deshannon | $168,000 | Stewart Title & Trust Of Pho | |
| Evans Camille | $95,000 | Capital Title Agency Inc | |
| Pilgrim Kevin A | $85,000 | Transnation Title Insurance | |
| Roberts Glenn A | -- | Stewart Title & Trust | |
| G & S Roberts Associates Ltd Partnership | -- | -- | |
| Roberts Glenn A | $70,485 | Stewart Title & Trust | |
| Rinne Geraldine | -- | Transnation Title Ins Co | |
| Rinne Geraldine | $70,000 | Transnation Title Ins Co |
Source: Public Records
Mortgage History
We collect this data history from publicly available records. To have your information removed, we recommend requesting removal directly through your county’s website.
| Date | Status | Borrower | Loan Amount |
|---|---|---|---|
| Open | Overfield Tara | $179,200 | |
| Previous Owner | Williamson Deshannon | $143,500 | |
| Previous Owner | Evans Camille | $94,158 | |
| Previous Owner | Pilgrim Kevin A | $76,500 | |
| Previous Owner | Roberts Glenn A | $55,000 | |
| Previous Owner | Roberts Glenn A | $19,000 |
Source: Public Records
Tax History
| Year | Tax Paid | Tax Assessment Tax Assessment Total Assessment is a certain percentage of the fair market value that is determined by local assessors to be the total taxable value of land and additions on the property. | Land | Improvement |
|---|---|---|---|---|
| 2025 | $1,428 | $10,963 | -- | -- |
| 2024 | $1,325 | $10,441 | -- | -- |
| 2023 | $1,325 | $25,330 | $5,060 | $20,270 |
| 2022 | $1,286 | $18,510 | $3,700 | $14,810 |
| 2021 | $1,297 | $17,010 | $3,400 | $13,610 |
| 2020 | $1,277 | $14,500 | $2,900 | $11,600 |
| 2019 | $1,248 | $14,300 | $2,860 | $11,440 |
| 2018 | $1,218 | $12,600 | $2,520 | $10,080 |
| 2017 | $1,160 | $12,660 | $2,530 | $10,130 |
| 2016 | $1,120 | $14,860 | $2,970 | $11,890 |
| 2015 | $1,041 | $8,410 | $1,680 | $6,730 |
Source: Public Records
Map
Nearby Homes
- 2810 E Glenrosa Ave Unit 18
- 2727 E Montecito Ave
- 4322 N 28th Way
- 2727 E Turney Ave
- 4323 N 28th Way
- 4331 N 27th Place
- 2740 E Roma Ave
- 4419 N 27th St Unit 22
- 2645 E Glenrosa Ave
- 4430 N 28th St Unit 8
- 4410 N 27th St Unit 6
- 2825 E Campbell Ave
- 2623 E Roma Ave
- 2950 E Turney Ave
- 4236 N 27th St Unit 38
- 3002 E Glenrosa Ave
- 4325 N 26th St Unit 8
- 3010 E Glenrosa Ave
- 2548 E Turney Ave
- 3001 E Campbell Ave
- 4315 N 28th St Unit 14
- 4315 N 28th St
- 4319 N 28th St
- 4311 N 28th St
- 4309 N 28th St
- 4307 N 28th St
- 4305 N 28th St
- 4316 N 28th St
- 4303 N 28th St
- 4301 N 28th St
- 2744 E Glenrosa Ave
- 4330 N 28th St
- 4327 N 28th St Unit 202
- 4327 N 28th St Unit 104
- 4327 N 28th St Unit 207
- 4327 N 28th St Unit 101
- 4327 N 28th St Unit 108
- 4327 N 28th St Unit 115
- 4327 N 28th St Unit 208
- 4327 N 28th St Unit 107
Your Personal Tour Guide
Ask me questions while you tour the home.