
Seller's Agent in 2025
Brock Fletcher
Keller Williams Realty Lansing
(517) 303-3262
2 in this area
277 Total Sales
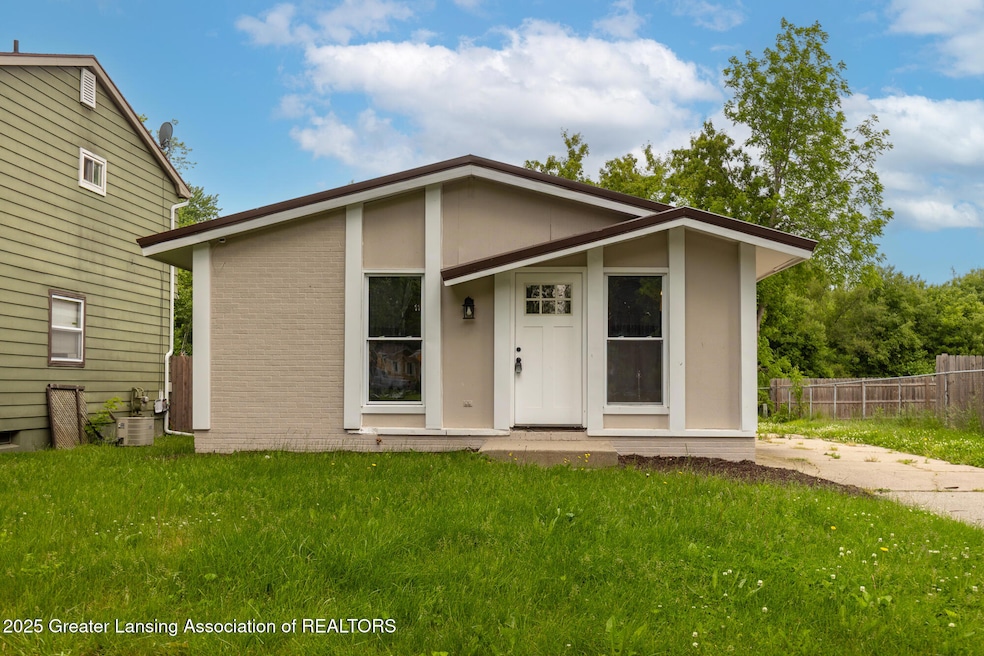
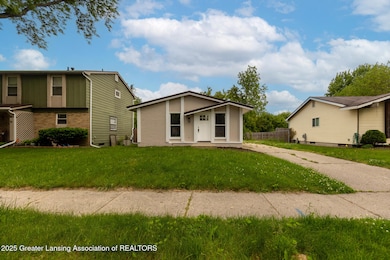
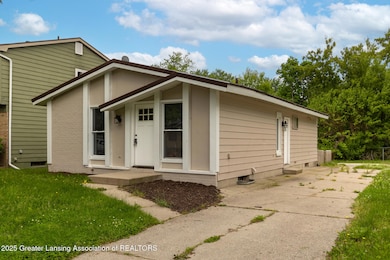
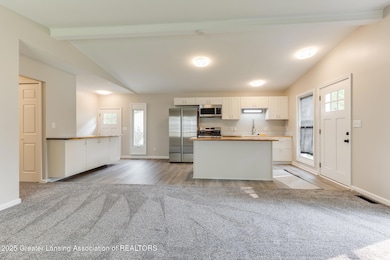
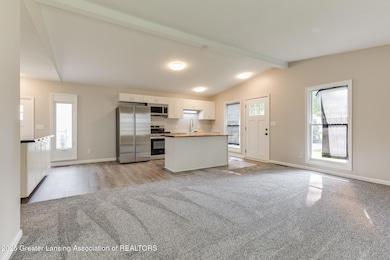
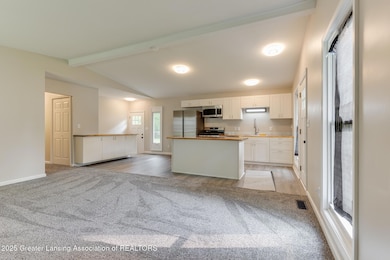
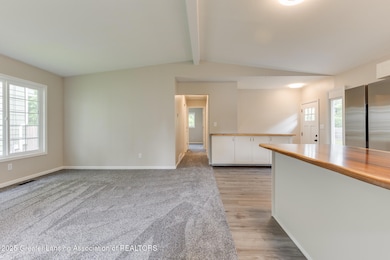
Welcome to 4318 Chadburne Drive in Lansing! This beautifully updated 3-bedroom home features a completely renovated kitchen with brand-new cabinets, countertops, stainless steel appliances, and durable Mohawk vinyl plank flooring. The bathroom has also been fully remodeled with a new tub and shower, vanity, toilet, sink, and matching vinyl plank flooring. Enjoy fresh new carpet in the living room and all bedrooms, along with updated light fixtures and fresh paint throughout the home. Nearly all windows have been replaced (except for two in the living room), and major mechanicals have been taken care of with a new furnace and central air conditioning installed in 2024. Topping it all off, the home features a metal roof that was replaced in 2012, providing long-lasting durability. This move-in-ready home blends comfort, style, and peace of mind!
Last Agent to Sell the Property
Keller Williams Realty Lansing License #6506042510 Listed on: 06/06/2025
| Date | Type | Sale Price | Title Company |
|---|---|---|---|
| Warranty Deed | $183,500 | Transnation Title | |
| Warranty Deed | $183,500 | Transnation Title | |
| Quit Claim Deed | -- | None Listed On Document | |
| Land Contract | -- | Attorney | |
| Quit Claim Deed | -- | Attorney | |
| Land Contract | -- | First American Title Ins Co | |
| Quit Claim Deed | -- | First American Title Ins Co | |
| Land Contract | -- | First American Title Ins Co | |
| Warranty Deed | $17,200 | Suntitle Agency |
| Date | Status | Loan Amount | Loan Type |
|---|---|---|---|
| Open | $163,800 | New Conventional |
| Date | Event | Price | List to Sale | Price per Sq Ft |
|---|---|---|---|---|
| 07/22/2025 07/22/25 | Sold | $183,500 | +4.9% | $182 / Sq Ft |
| 07/15/2025 07/15/25 | Pending | -- | -- | -- |
| 06/06/2025 06/06/25 | For Sale | $175,000 | -- | $174 / Sq Ft |
| Year | Tax Paid | Tax Assessment Tax Assessment Total Assessment is a certain percentage of the fair market value that is determined by local assessors to be the total taxable value of land and additions on the property. | Land | Improvement |
|---|---|---|---|---|
| 2025 | $2,663 | $51,900 | $0 | $0 |
| 2024 | $4,118 | $45,800 | $0 | $0 |
| 2023 | $4,118 | $42,100 | $0 | $0 |
| 2022 | $1,764 | $37,300 | $0 | $0 |
| 2021 | $1,697 | $35,100 | $0 | $0 |
| 2020 | $1,695 | $32,700 | $0 | $0 |
| 2019 | $1,663 | $29,900 | $0 | $0 |
| 2018 | $1,485 | $25,700 | $0 | $0 |
| 2017 | $1,459 | $25,300 | $0 | $0 |
| 2016 | $1,120 | $25,200 | $0 | $0 |
| 2015 | -- | $25,100 | $0 | $0 |
| 2014 | -- | $26,100 | $0 | $0 |
| 2013 | -- | $27,000 | $0 | $0 |
Seller's Agent in 2025
Brock Fletcher
Keller Williams Realty Lansing
(517) 303-3262
2 in this area
277 Total Sales
C
Buyer's Agent in 2025
Courtney Miller
RE/MAX Michigan
(517) 669-8118
1 in this area
19 Total Sales
Source: Greater Lansing Association of Realtors®
MLS Number: 288738
APN: 235-040-364-035-01
Disclaimer: Certain information contained herein is derived from information provided by parties other than Homes.com. All information provided is deemed reliable, but is not guaranteed to be accurate and should be independently verified.
![]() IDX information is provided exclusively for Consumers'
IDX information is provided exclusively for Consumers'
personal, non-commercial use, that it may not be used for any purpose other than to identify prospective properties Consumers may be interested in purchasing. Data is deemed reliable but is not guaranteed accurate by the MLS.
Copyright © 2026 Greater Lansing Association of REALTORS®
Ask me questions while you tour the home.